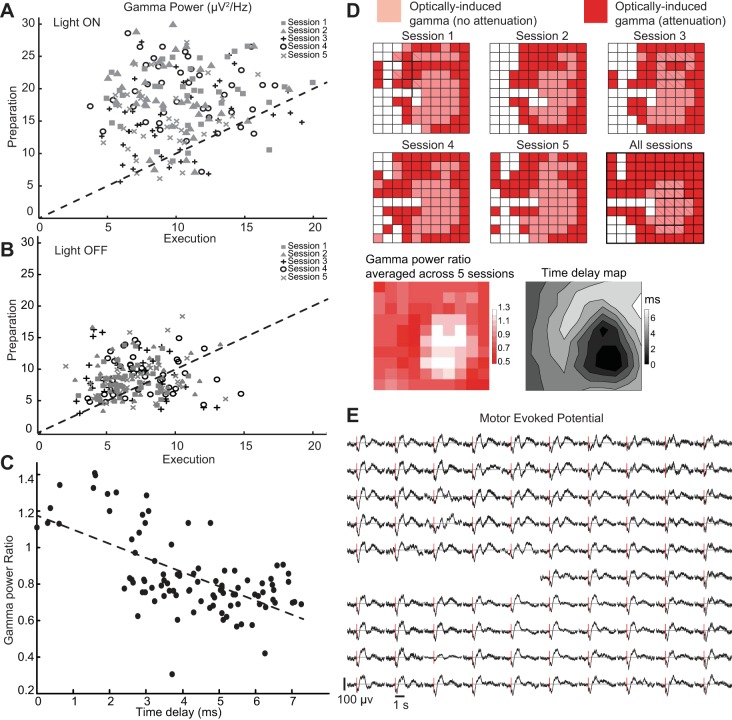
Fig. 8.
Movement execution attenuates optogenetically induced gamma oscillations: summary over trials and recording sites. A: power of optically induced gamma during movement preparation (horizontal) and execution (vertical) for recording site 95. Each dot is the power of 1 trial (n = 40 trials each session, subject T) in 5 experimental sessions. PSD was computed as described in Fig. 7. B: same scatterplot in control condition (light OFF). C: the level of attenuation in optically induced gamma oscillations during movement execution was anticorrelated with the time delay (linear regression, P = 10−10, r2 = 0.4), indicating that sites away from the directly stimulated area tended to show larger attenuation effects. D, top: recording sites over the array where induced gamma was attenuated during the movement execution phase (red) and where gamma was not affected (light red). Bottom: summary over recording sites on the microelectrode array: the heat map denotes the ratio between the gamma power during movement execution and during preparation. Values < 1 indicate attenuation of the optically induced gamma oscillation. E: average motor evoked potentials in 1 session for all of the recording sites. Motor evoked potentials were detected in all of the recording sites and did not seem to play a role in the suppression or not of optically induced gamma oscillations.

