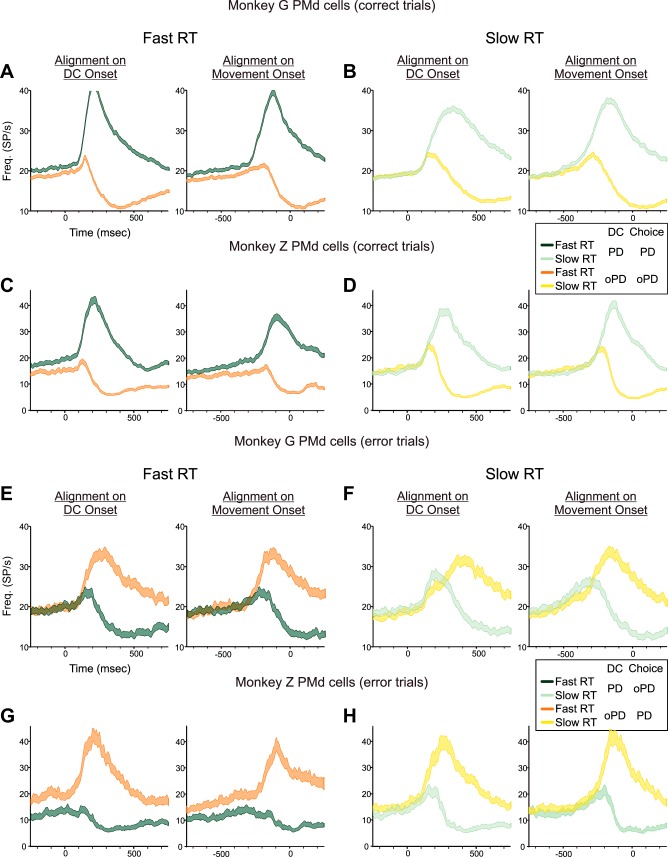
Fig. 12.
A–D: mean activity (±SE) of PMd neurons recorded in both hemispheres of monkeys G and Z in trials in which they chose the correct target in response to PD-DCs (green histograms) and oPD-DCs (orange histograms). Data are shown for the 1/3 of the trials that had the shortest RTs (A and C) and the 1/3 of trials with the longest RTs (B and D). E and F: mean activity (±SE) of PMd neurons recorded in both hemispheres of monkeys G and Z in trials in which they chose the incorrect target in response to PD-DCs (green histograms) and oPD-DCs (orange histograms). Data are shown for the 1/3 of the trials that had the shortest RTs (E and G) and the 1/3 of trials with the longest RTs (F and H). As in all previous population histogram figures, the colors of the histograms signify the correct targets supported by the DC color bias, not the response choices of the monkeys.

