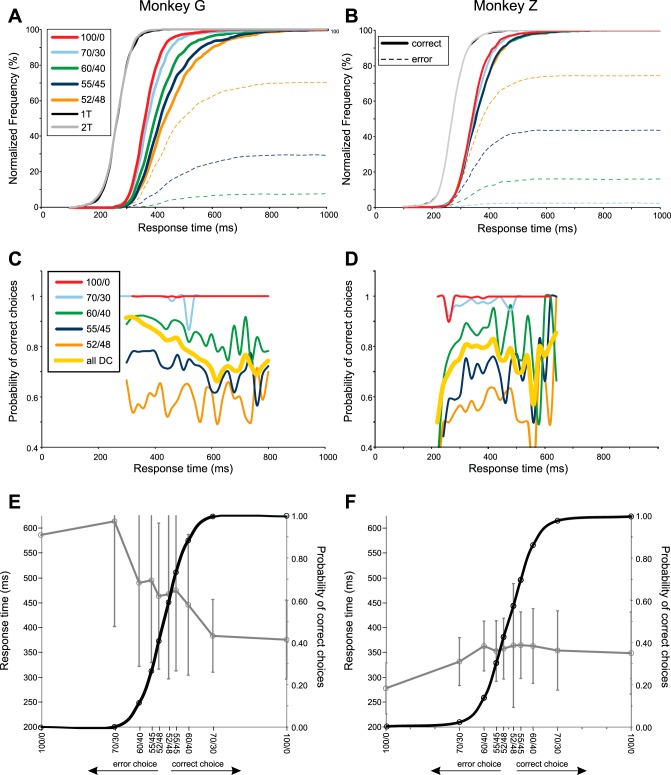
Fig. 3.
Choice behavior of monkey G (left) and monkey Z (right). A and B: normalized cumulative frequency plots of the behavioral response times (RT) for trials in which the monkeys made correct (solid lines) and incorrect (broken lines) target choices in the 1T and 2T tasks, and in response to DCs with differing degrees of conflicting sensory evidence. Success rates were nearly 100% for the 100/0 and 70/30 DCs for monkey G and for the 100/0 DCs for monkey Z. As a result, the error-choice cumulative curves are not visibly distinct from the horizontal axis in the figures for those DCs. C and D: success rate as a function of time for each DC, separately (solid colored lines), as well as pooled across all DCs (thick yellow line). E and F: psychometric curves for the probability of correct and error choices as a function of DC quality (solid black line) and the chronometric curves for the corresponding RTs (mean ± SD) (gray line). Data from DCs that were predominantly yellow or blue were pooled for these psychometric and chronometric curves. Data from both hemispheres were pooled for monkey G.

