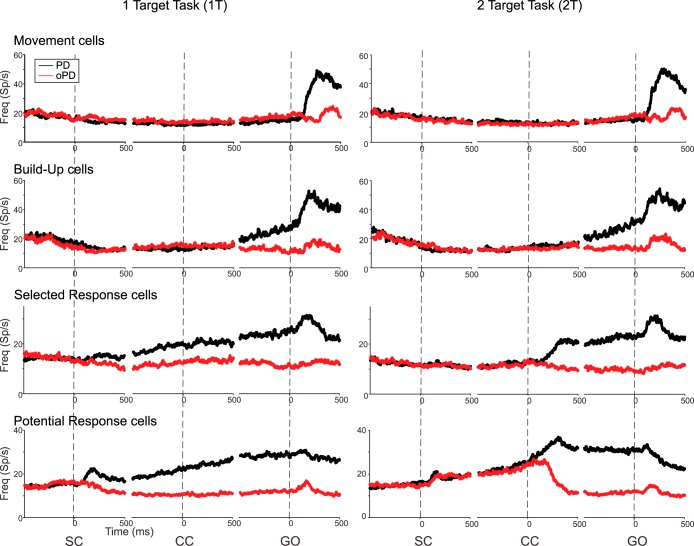
Fig. 4.
Population histograms of neurons with four different response patterns in the 1T (left) and 2T (right) tasks. In each histogram, neural activity is aligned to SC onset (left), CC onset (middle), and GO cue onset (right). Black, responses for trials toward each neuron's preferred target location; red, responses for trials toward the opposite target location.

