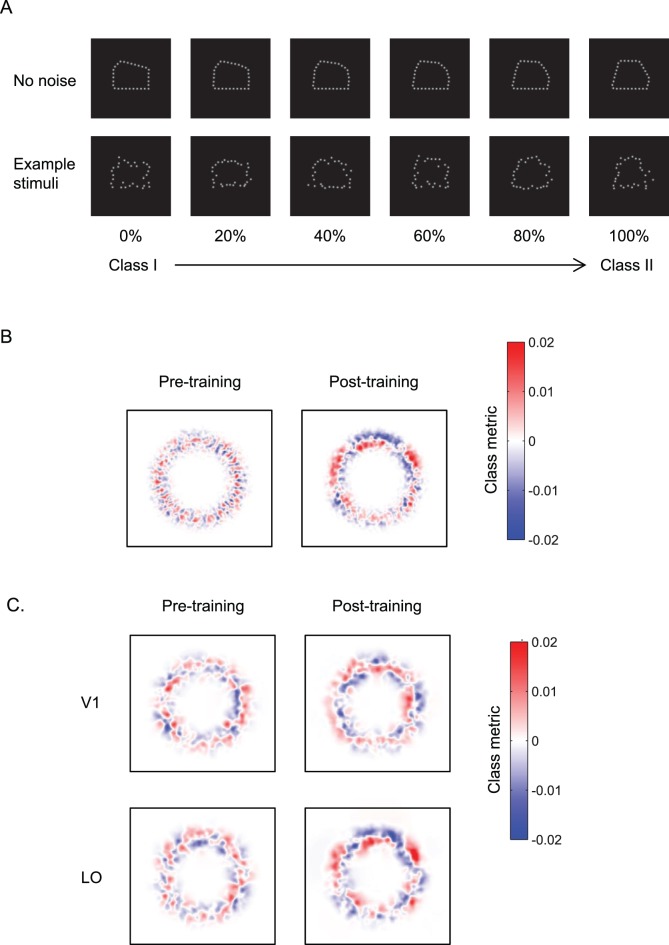
Figure 3.
Learning optimizes decision templates. (A) Sample pentagon-like stimuli comprising 30 equally spaced Gaussian dots with 0.1° SD. Two classes of shapes were generated by varying the location of the pentagon lines that differed in their length. The top panel shows the stimulus space generated by linear morphing between Class I and Class II polygons (stimuli are shown as a function of percent Class II). The bottom panel shows example stimuli with position noise, as presented in the experiment. (B) Behavioral classification images before and after training, averaged across participants. (C) fMRI classification images for V1 and LO before and after training, averaged across participants. Red indicates image locations associated with a Class I decision, while blue indicates image locations associated with a Class II decision. Adapted with permission from Kuai et al. (2013).

