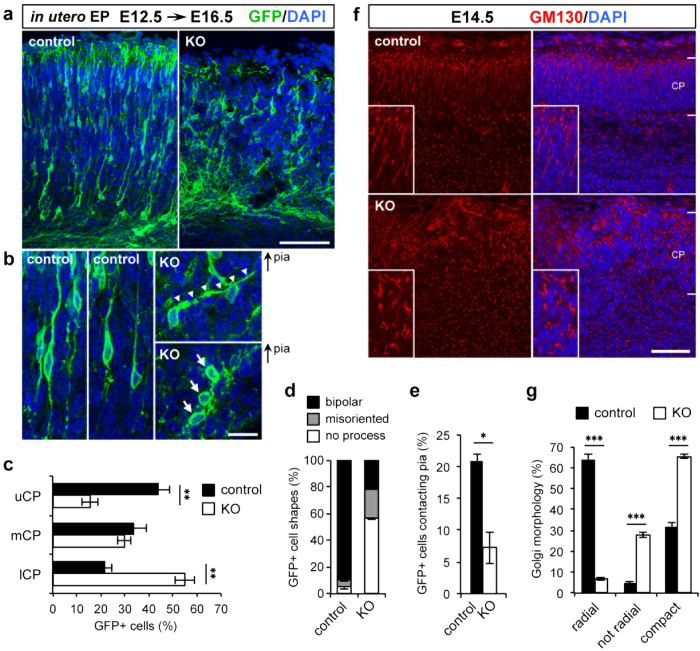
Figure 5. Excitatory neurons in the Pomgnt2-KO cortex display aberrant migratory behaviors.
(a) Coronal sections of E16.5 control and Pomgnt2-KO brains following in utero electroporation with the pCAGGS-GAP-Venus plasmid (encoding a modified GFP variant) at E12.5. Immunostaining for GFP visualizes the distribution and morphology of the migrating neurons. (b) Enlarged images showing a closer view of the migrating neurons in (a). In the Pomgnt2-KO cortex, neurons with an incorrectly oriented leading process (indicated by arrowheads) or with no leading process (indicated by arrows) were observed. Panels are placed with the pial surface to the top. (c–e) Quantification of the distribution of GFP+cells in different zones of the CP (c), morphology of GFP+cells (d), and percentage of GFP+cells contacting with the pial surface (e). uCP, upper CP; mCP, median CP; lCP, lower CP. The graph shows the mean ± SEM from 3 embryos for each genotype. Student’s t-test; *P < 0.05, **P < 0.01. (f) Coronal sections of the developing brain from control and Pomgnt2-KO embryos at E14.5 were immunostained for GM130 to analyze the morphology of the Golgi apparatus. Magnified images of the Golgi apparatus in the CP are shown in the insets. (g) Golgi morphology was assigned to three categories (radial, not radial, and compact), and the number of Golgi bodies in each category was quantified. The graph shows the mean ± SEM from 4 embryos for each genotype. Student’s t-test; ***P < 0.001. Scale bars represent 100 μm (a), 20 μm (b), and 50 μm (f).

