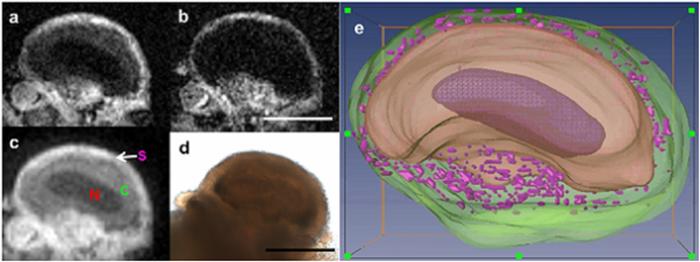
Figure 3. Direct correlation of Aplysia neuron morphology in MRM and histological images.

(a) One slice from a 3D spin echo image of the entire fixed L7 neuron illustrating cellular compartments using a micro surface-coil at 600 MHz NMR spectrometer, MRM scan parameters: 3D spin echo sequence with TE/TR = 8.4/1000 ms, resolution = 7.8 × 7.8 × 15 μm3, FOV = 1 mm × 1 mm × 1 mm, matrix = 128 × 128 × 64, NEX = 10, acquisition time = 22 hrs 51 min. (b) The same slice at an increased TE of 12 ms. (c) Lower resolution image presenting the possible plasma membrane. MRM scan parameters: 3D spin echo sequence with TE/TR = 8.4/1000 ms, resolution = 12 × 12 × 15 μm3, FOV = 1.5 mm × 1.5 mm × 1 mm, matrix = 128 × 128 × 64, NEX = 6, acquisition time = 13 hrs. (d) Corresponding light microscopic image illustrating signal heterogeneity in the outer periphery and connective tissue. Nucleus (N), Cytoplasm (C), Satellite cell region (S), (e) 3D visualization generated by interpolating multiple slices of 3D MRM images. Nucleus (dark purple), cytoplasm (beige), and satellite cells (purple) in the satellite cell region (green). Scale bar = 300 μm.
