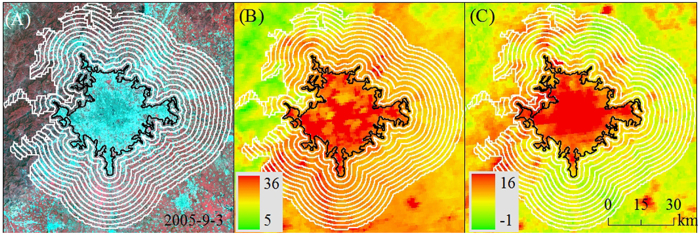
Figure 2. The delineation of urban area and twelve buffer zones, an example of Beijing.

Landsat TM false color image acquired in Sep 3rd 2005 with a spatial resolution of 30 m × 30 m (A), daytime land surface temperature (LST) (B), and nighttime LST (C) in 2005. The black line stands for the border of urban area, the land within the border was considered as urban area, and the white lines represent the border of buffers (each of them covers half of actual urban area). Pixels that were water body or with elevation more than 50 m higher than the highest point in urban area were excluded from this analysis. Maps were generated using ArcGIS 9.3 (www.esri.com/software/arcgis).
