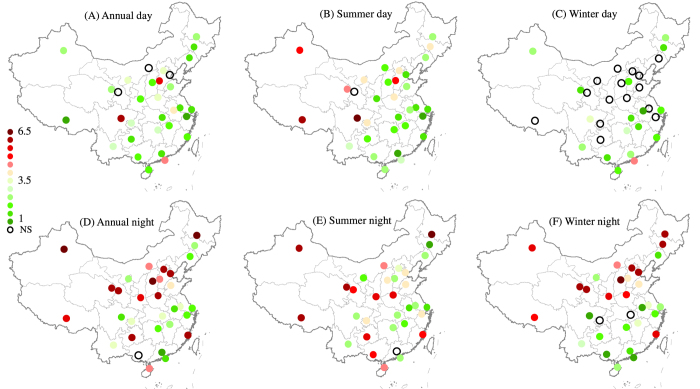
Figure 6. The footprint of urban heat island effect (FP, times of urban area) for China’s 32 major cities averaged over 2003–2012.
The hollow black circle indicates no significant urban heat island effect for the city (NS). Maps were generated using ArcGIS 9.3 (www.esri.com/software/arcgis).

