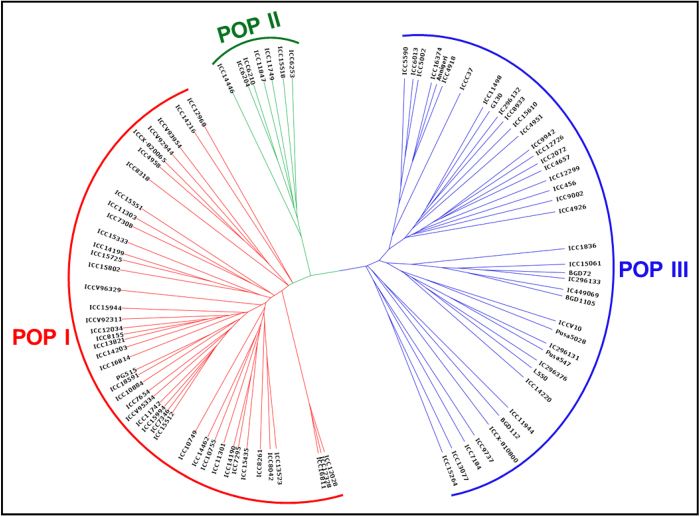
Figure 1. Unrooted phylogenetic tree depicting the genetic relations among 92 desi and kabuli chickpea accessions belonging to a seed and pod trait-specific association panel based on Nei’s genetic distance using 44844 high-quality GBS-based SNPs (MAF ≥ 0.05).
Molecular classification differentiated these accessions into three different clusters/populations (POP I, POP II and POP III) as expected based on their cultivar/species-specific origination.

