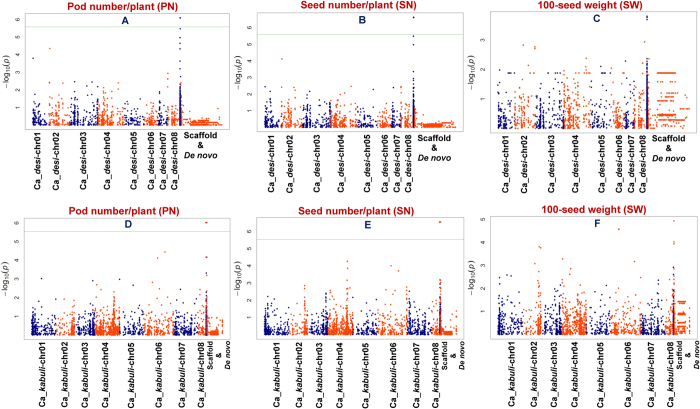
Figure 6. GWAS showing significant P-values (estimated integrating GLM, MLM, EMMA and CMLM) associated with three seed and pod yield-contributing traits (PN, SN and SW) using 20439 desi (A, B and C) and 24405 kabuli (D, E and F) SNPs (MAF ≥ 0.05).
The x-axis indicates the relative density of identified reference genome- and de novo-based SNPs physically mapped on eight chromosomes and scaffolds of desi and kabuli. The y-axis represents the -log10 P-value for significant association with traits. The SNPs with P values ≤ 1x10⁻⁶ showing strong trait association are demarcated with lines. The SNPs with P-values ≤ 10−4 are considered significant for trait association.

