
Figure 4.
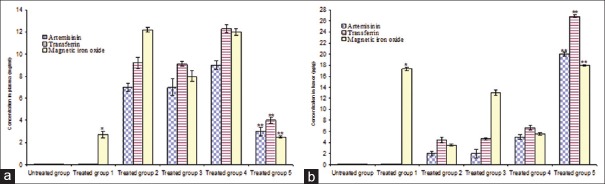
The artemisinin, transferrin and magnetic iron oxide concentrations in the plasma (a) and tumors (b) of treated mice. *Significant difference between treated group 1 versus control and treated groups 2, 3 and 4 (P < 0.01); **Significant difference between treated group 5 versus control and treated groups 2, 3 and 4 (P < 0.01)