
Figure 1.
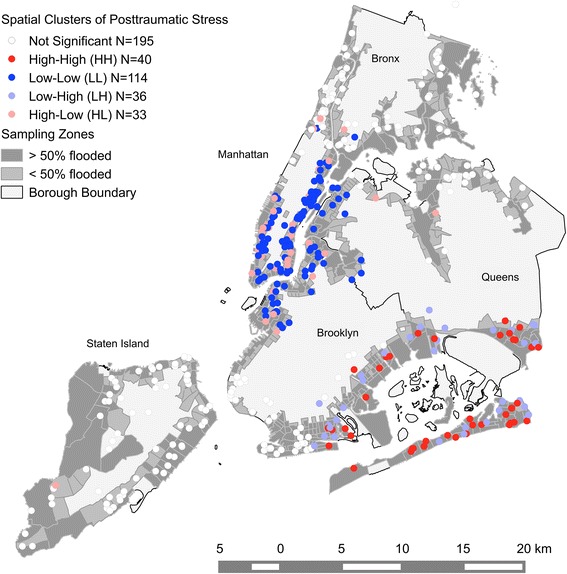
Spatial clusters of PTS. Each dot on the map indicates a respondent’s location. The map indicates significant (p < 0.05) spatial clusters of high (HH) or low (LL) PTS. High values surrounded by low values (HL) and vice versa (LH) indicate outliers. A fixed distance of 9 km was used in the statistics. Note that a geometric shift of approx. 100 m has been introduced for displaying the point data so that single houses may not be identified for privacy reasons.