
Fig. 4.
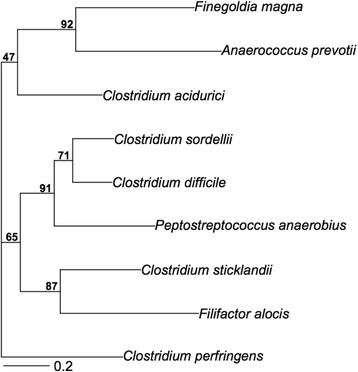
Phylogeny. Maximum likelihood tree obtained from a concatenated nucleotide sequence alignment of the 134 orthologous genes of the 9 bacterial species from Clostridial clusters I, XI, XII, and XIII. The horizontal bar at the base of the figure represents 0.2 substitutions per nucleotide site. The percentages of genes that support the branches of the tree are indicated