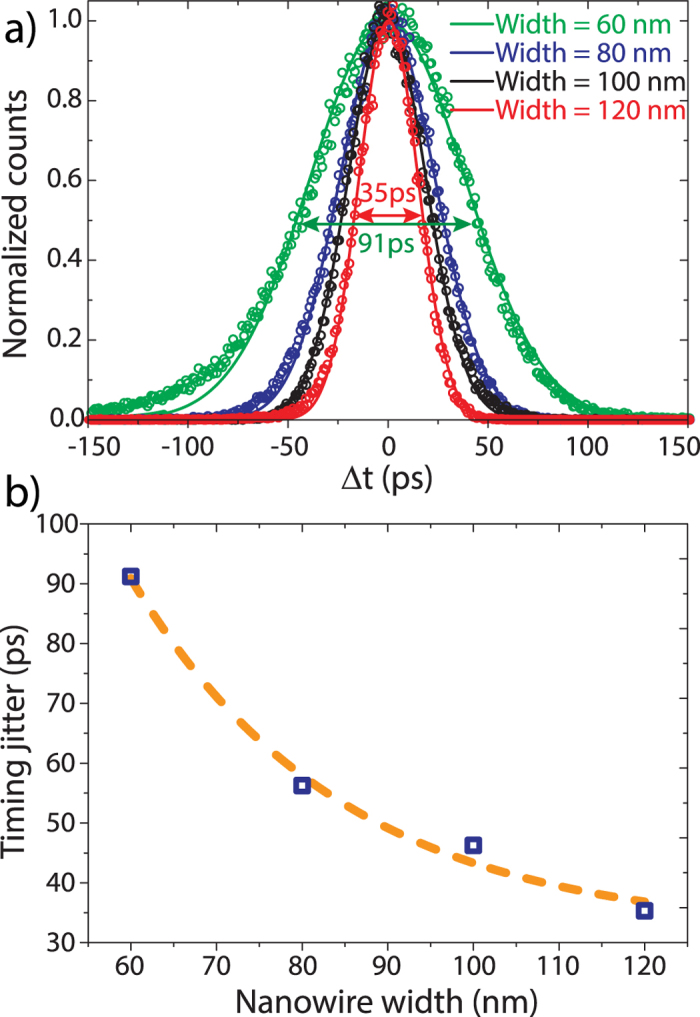
Figure 5.

a) Histogram data obtained during the jitter measurement of various nanowire widths (empty circles) and corresponding Gaussian fit (solid line). The double-arrows indicate the timing jitter, i.e. the full width at half maximum (FWHM) obtained from the fits. b) Timing jitter as a function of nanowire width showing decreasing timing jitter with growing nanowire width.
