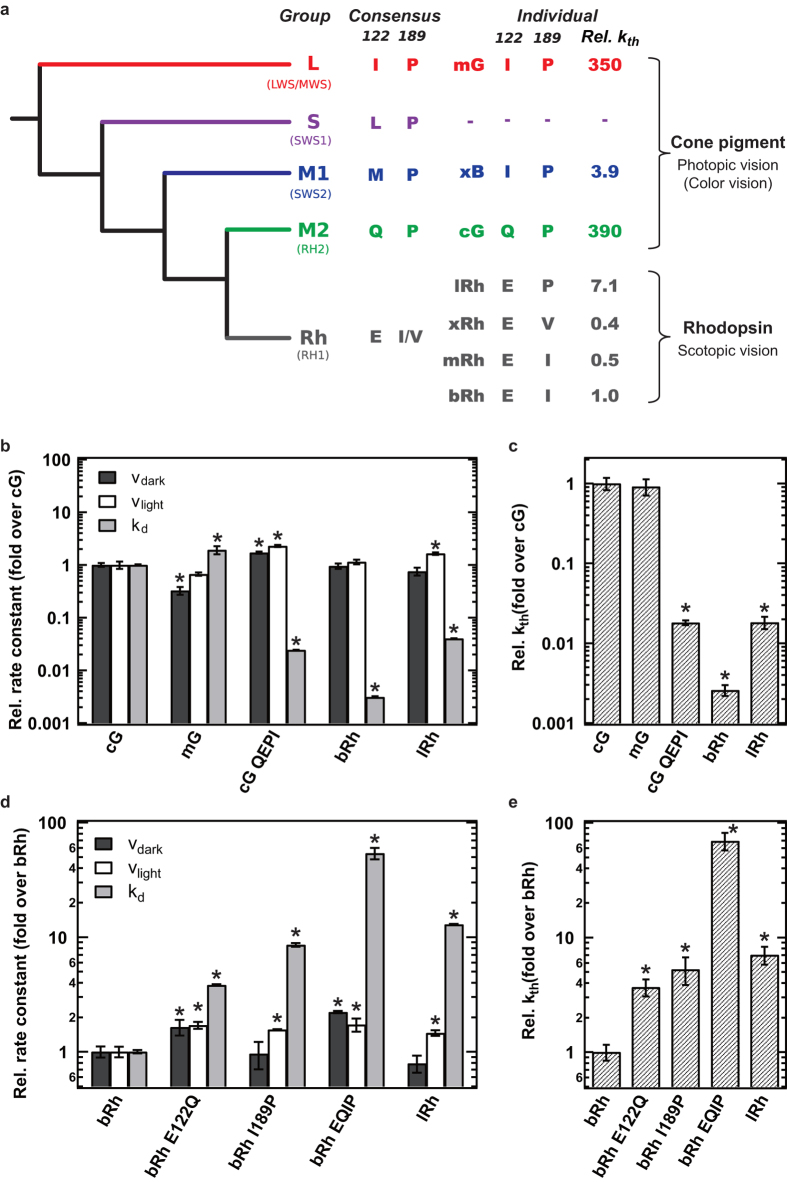
Figure 3. Comparison of the kth of the wild-type and mutants of bRh, cG, and lRh.
(a) Schematic diagram of phylogenetic relationship of vertebrate visual pigments. The amino acids at position 122 and 189 conserved in each group (consensus) and those of each visual pigment analyzed in the present study (individual) are denoted. The right column (Rel. kth) shows the relative kth of visual pigments estimated from the analysis shown in the text (fold over bRh). The complete phylogenetic tree is available as Supplementary Fig. 5. (b-e) The vdark, vlight, kd of the wild-type and mutants of visual pigments were compared in (b,d). The kth estimated from the data in (b) and (d) were compared in (c) and (e), respectively. Error bars represent the S.E.M. of more than three independent measurements. * indicates a significant difference of relative rate constants between visual pigments relative to cG in (b,c) and bRh in (d,e) (p < 0.05; Student’s t- test, two-tailed).

