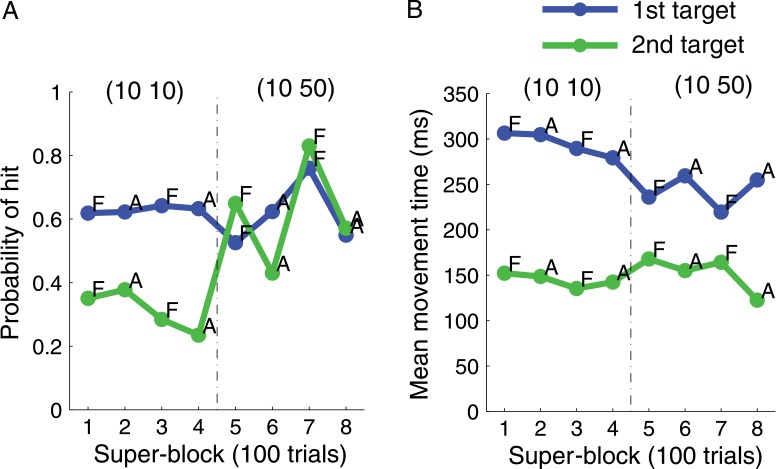
Figure 8.
Subject S03's data. (A) The mean probability of hitting each target separately for each super-block. (B) Mean movement time for each target by super-block. Legends (10 10) and (10 50) denote the two value conditions. F denotes the choice timing condition. A denotes the constrained timing condition.

