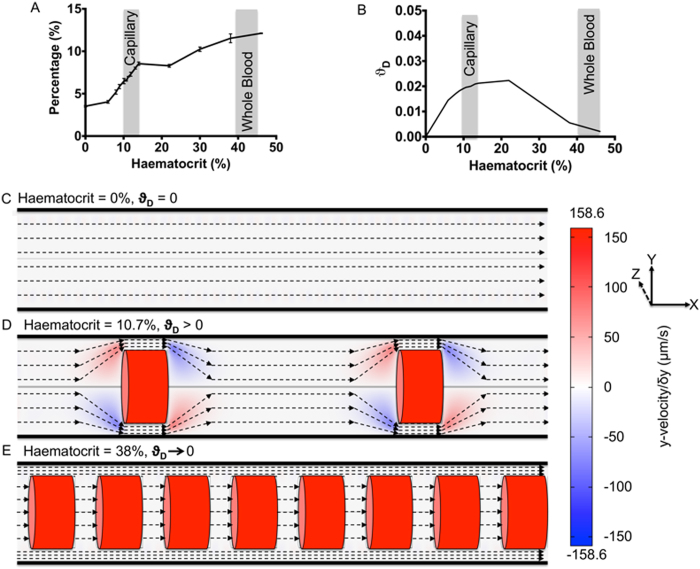
Figure 4. The Effect of Haematocrit on Nanoparticle Distribution and Motion.
The increased dispersion of nanoparticles to the vessel edge as a function of increasing haematocrit is demonstrated by the percentage of nanoparticles within 20 nm of the vessel wall (A). The average dispersion factor is then shown as a function of haematocrit (B). Typical ranges for capillary and whole blood haematocrits are indicated. Streamlines of different types of flow observed and heatmaps of the velocity in the y-plane are shown with respect to haematocrit, at no haematocrit (H% = 0) a one phase Poiseuille’s flow (C), at 10.7% representative of intermediate haematocrits (0 < H% < 20) an interacting flow between cellular and cell-free layers (D) and a haematocrit of 38% representative of high haematocrits (H% > 20) separate cellular and cell-free layers (E).

