Figure 1.

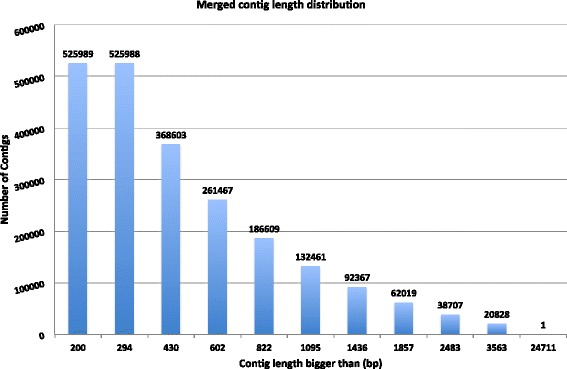
Assembled contig length distribution. Each number on top of each bar represents number of assembled contigs per length category.

Assembled contig length distribution. Each number on top of each bar represents number of assembled contigs per length category.