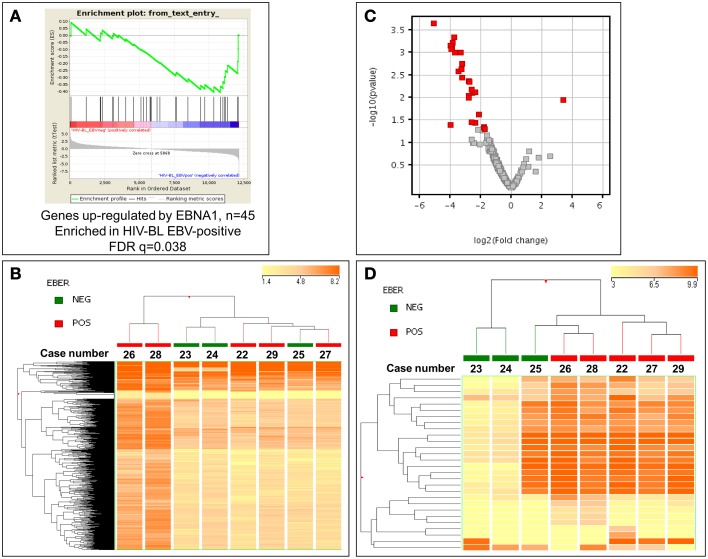
Figure 3.
EBV might interfere with gene and microRNA expression profiling of EBV-positive and EBV-negative ID-BL. (A) GSEA shows differential expression of the genes up-regulated by EBNA-1 between ID-BL EBV-positive and ID-BL EBV-negative (n = 45). GSEA was done with a list of genes up-regulated by EBNA-1 obtained by Dresang et al. (2009). After filtering and normalization, the ~12,000 genes included in the microarray are ranked on the X axis (“rank in ordered data set”) of the graph from left to right. Genes on the left are up-regulated in EBV-negative cases, whereas the genes ranked to the right are up-regulated in EBV-positive cases. Green line represents the enrichment score (ES, Y axis) with a maximum (absolute value) ES at ~ -0.4; black vertical lines, position of individual genes (up-regulated by EBNA-1) from the used gene set in the ordered list of ~ 12,000 genes. To derive significance, the data set was permuted 1000 times and random ES were calculated. The FDR-q-value was = 0.038, indicating that the observed distribution is unlikely due to chance. (B) Unsupervised analysis failed to discriminate EBV-positive and EBV-negative cases. In the matrix, each column represents a sample, and each row represents a miRNA. The color scale bar shows the relative miRNA expression changes normalized to the standard deviation (0 is the mean expression level of a given miRNA). (C). Supervised analysis identified 28 miRNA differentially expressed between the two groups, with almost all of them to be up-regulated in EBV-positive ID-BL. In the Volcano plot miRNA with a p-value ≤ 0.05 (y-axis, log scale) and fold change ≥ 2 (x-axis, log scale) are depicted as red squares. (D) Based on the expression of the identified miRNAs, the two groups were clearly discriminated in a HCA. In the matrix, each column represents a sample, and each row represents a miRNA. The color scale bar shows the relative miRNA expression changes normalized to the standard deviation (0 is the mean expression level of a given miRNA).

