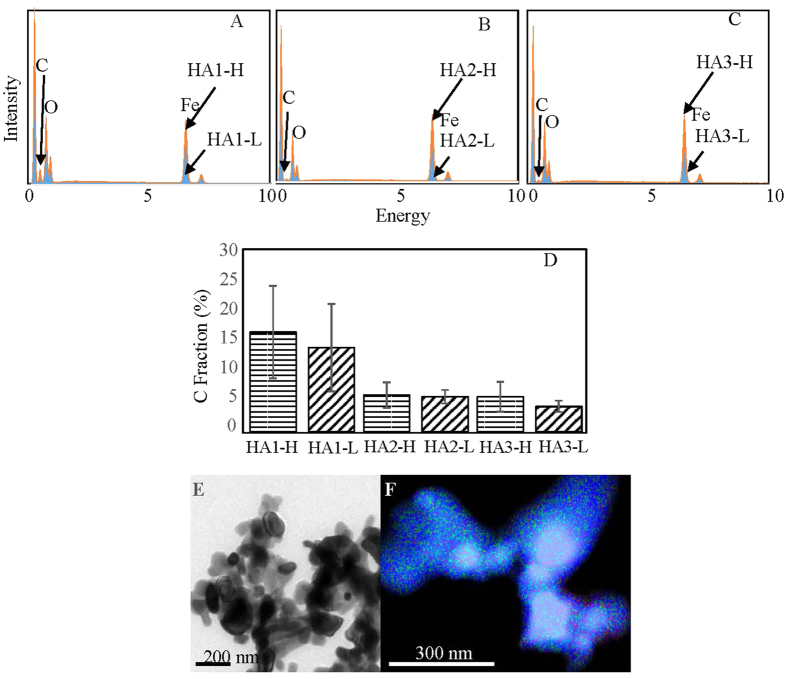
Figure 2.
(A–C) Surface chemical compositional analysis for hematite-organic matter complex, determined by scanning electron microscopy coupled with energy dispersive spectroscopy (SEM-EDS). (D) Comparison of surface carbon composition for samples with highest and lowest bulky carbon content, based on EDS analysis. HA1-H, HA2-H, and HA3-H represent samples with highest carbon content, and HA1-L, HA2-L, and HA3-L stand for those with lowest carbon content. (E–F) Transmission electron microscope (TEM) observations for particles of HA3-hematite complex (E) and the EDS-based elemental distribution (F), with blue for iron, green for oxygen, and red for carbon.

