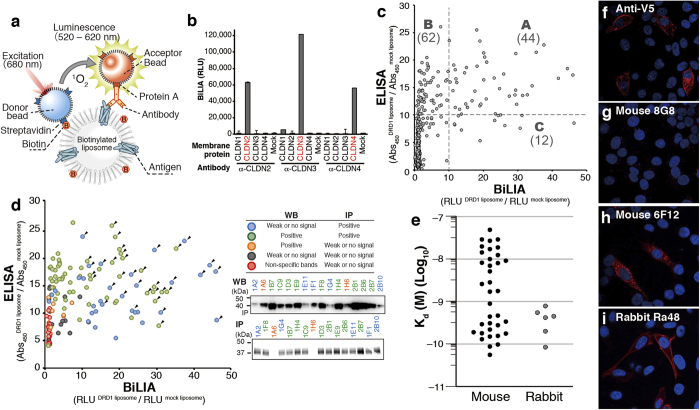
Figure 2. Development and characterization of anti-DRD1 antibodies using cell-free synthesized antigen.
(a) Schematic diagram of antibody screening by BiLIA. GPCR antigen was synthesized on a biotinylated liposome. When antibody binds to GPCR as illustrated, AlphaScreen beads generate chemiluminescence signal. (b) Subtype specific binding of anti-claudin (CLDN) antibodies detected by BiLIA. CLDN2, 3, 4 were synthesized by bilayer method in the presence of biotinylated liposome. Anti-claudin antibodies were purchased from Life Technologies. Error bars represent standard deviation of the mean (n = 4). (c) Primary screening of mouse mAbs. Each culture supernatant of 764 hybridoma clones was assayed by both ELISA and BiLIA, respectively. Each plot represents a hybridoma clone. Broken lines indicate a threshold of specific binding. (d) Binding mode analysis of 143 mouse hybridoma clones. Supernatant of selected 143 clones was analyzed by WB and IP. Representative results of WB and IP were shown and detailed results of each supernatant were shown in Supplementary Table S2 online. Color of each plot indicates the binding mode. Arrowheads indicate 36 mAb clones selected for further analysis. (e) Affinity of 36 mouse mAbs and 6 rabbit mAbs. The antibody affinity (Kd) was determined by Scatchard plots. All data are representative out of at least two independent experiments with similar results. (f–i) Immunostaining of DRD1-V5 overexpressed HeLa cells. Representative data were shown. Red, antibody detected by PLA; blue, DAPI. (f) Anti-V5 antibody. (g) Mouse mAb clone 8G8, where significant PLA signal was not detected. (h) Mouse mAb clone 6F12. (I) Rabbit mAb clone Ra48.

