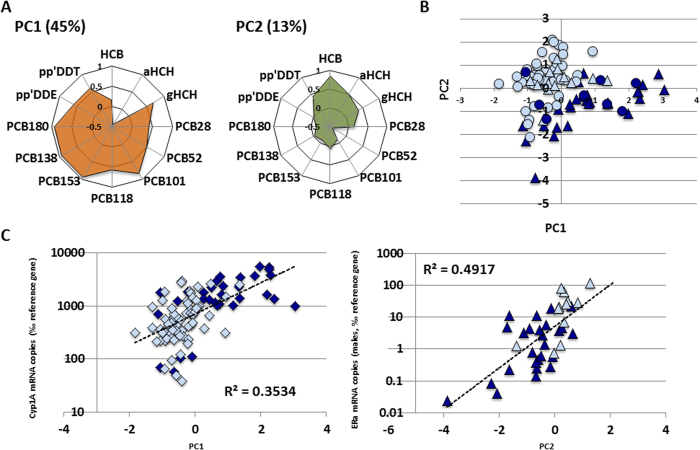
Figure 2. Results of Principal Component Analysis.
A) Loading plots for PC1 and PC2; the explained variation for each PC is indicated. B) Score plot for PC1 and PC2. Males and females are indicated by triangles and circles, respectively. Specimens from Pyrenees and Tatras are indicated by pale and dark blue symbols, respectively. C) Correlations between PC1 (left) and PC2 (right) scores and Cyp1A (all fish) and ERα mRNA levels (males), respectively. The corresponding linear regression (semi-log transformation) and the correlation coefficients are shown.

