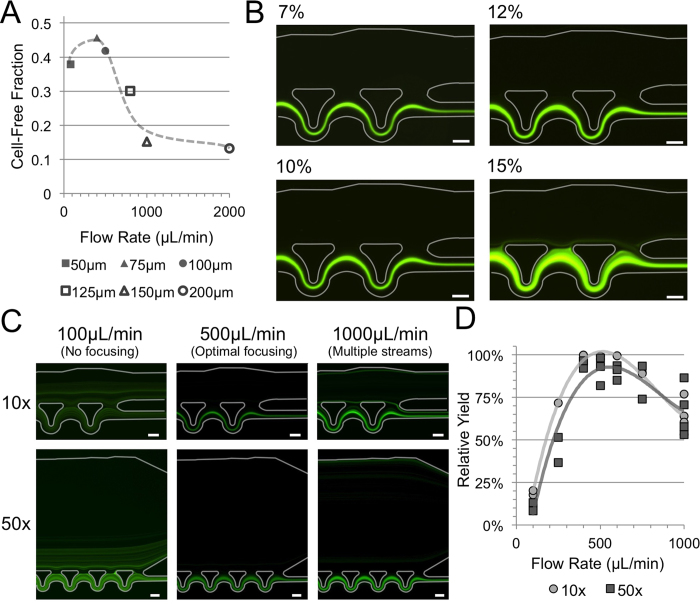
Figure 2. Relating Siphon Percentage and Flow Rate:
(A) Plot of the maximum cell free fraction for different width devices plotted versus the flow rate at which the maximum cell free fraction is achieved. The thickness is given as a percentage of the channel width at a point downstream of the focusing units. (B) Fluorescent streak images of labeled buffy coat run through different 10x concentrator devices that were designed with increasing siphon percentages from top to bottom showing the loss of cells at the higher siphon percentages. (C) Fluorescent streak images of the 10x and 50x devices operating at different input flow rates increasing from left to right. The loss of cells at 100 μL/min is due to the lack of inertial focusing forces at the lower speeds. Optimal focusing performance is at the designed flow rate of 500 μL/min. The loss of cells at the higher flow rates can be seen at the top wall of the siphon channels where a well formed streak is located which exits the focusing channels at the first siphon. (D) The relative yield (# of cells in product / # of cells in product + waste) of the 10x and 50x devices with an input concentration of 1 M cells/mL at different flow rates. Scale bars are 50 μm.

