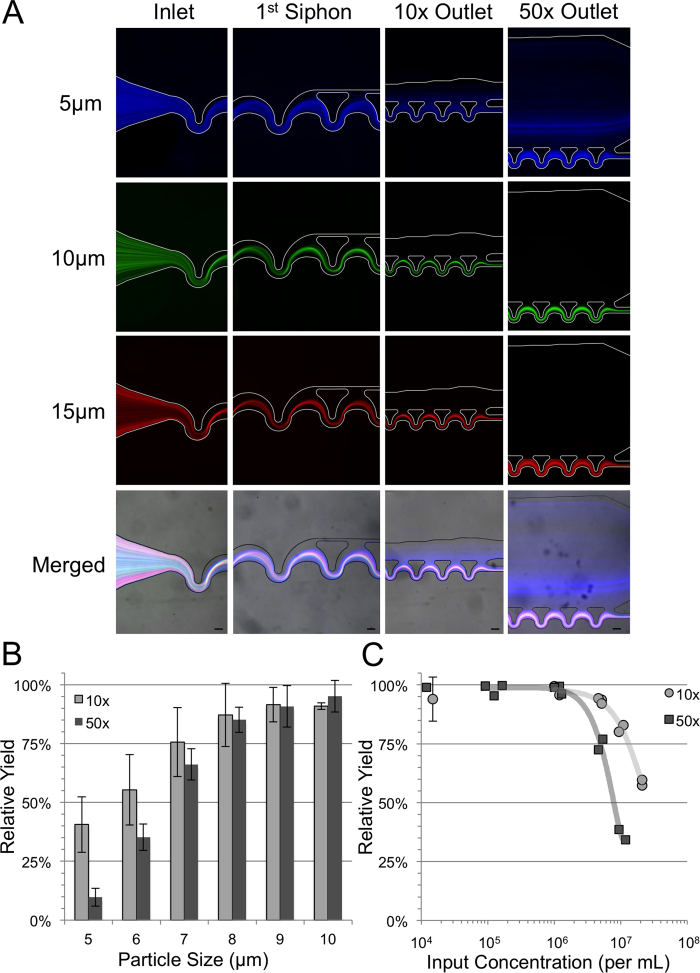
Figure 3. Particle Size and Concentration Dependence:
(A) Fluorescent streak images showing the particle size sensitivity of the 10x (left) and 50x (right) devices. The particle diameter increases from the top row (4.4 μm blue) to the second row (9.9 μm green) to third row (15 μm red) and merged together with brightfield in the bottom row. Scale bars are 50 μm. (B) The size sensitivity of the relative yield through the 10x and 50x devices tested using discrete sizes of polystyrene particles. Error bars indicate plus/minus one standard deviation. (C) A plot of the relative white blood cell yield for the 10x and 50x devices as a function on input concentration showing the sharp drop off around 1 M cells/mL. All input concentrations below 20,000 cells per mL are grouped (N = 63 for 10x and N = 3 for 50x). Error bars indicate plus/minus one standard deviation.

