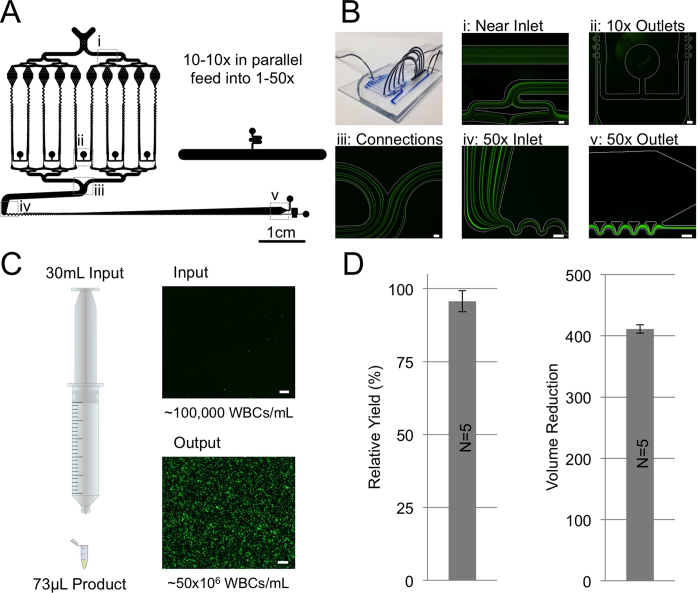
Figure 4. Serially Integrated 500x Device Design and Performance:
(A) Schematic of the 500x device labeled with imaging positions. (B) Image of the device and fluorescent streak images of the device in operation showing (i) particles entering the device dispersed, (ii) a pair of 10x device outlets, (iii) ten joined streams of particles from the first stage of 10x devices, (iv) entrance of the 50x device where the ten stream become one and (v) the outlet of the 50x device. (C) Schematic representation of the typical input sample and output samples sizes with associated fluorescent images from one sample run. (D) The actual volume reduction factor measured as well as the relative yield over 5 different sample runs. Error bars indicate plus/minus one standard deviation. Scale bars are 100 μm unless otherwise noted.

