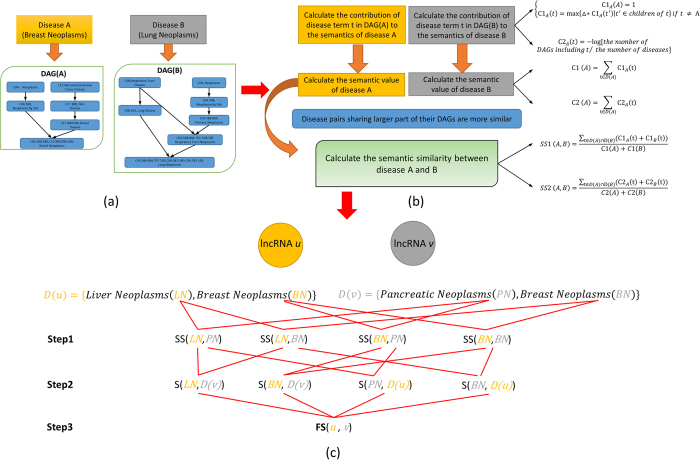
Figure 1. Flowchart of LNCSIM, demonstrating the basic ideas of calculating functional similarity between two lncRNAs.
The following three steps have been included: (a) identified diseases associated with lncRNA u and v and constructed their disease DAGs; (b) calculated semantic similarity between diseases in the disease groups associated with lncRNA u and v; (c) obtained functional similarity between lncRNA u and v by calculating the similarity between corresponding disease group associated with each lncRNA. DAG: directed acyclic graph; LN: Liver Neoplasms; BN: Breast Neoplasms; PN: Pancreatic Neoplasms; D(u) and D(v): the disease groups associated with lncRNA u and v; SS(LN,PN): disease semantic similarity matrix between disease LN and PN; S(LN, D(v)): the similarity between LN and the disease groups associated with lncRNA v: FS(u,v): the functional similarity between lncRNA u and v.

