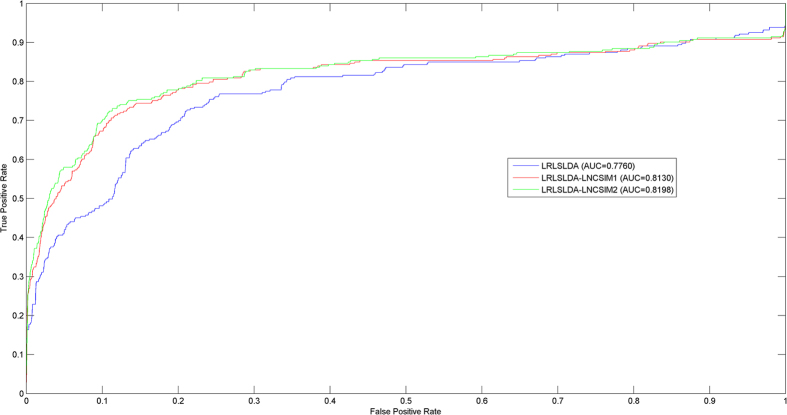
Figure 3. Comparison between LRLSLDA, LRLSLDA-LNCSIM1, and LRLSLDA-LNCSIM2 in terms of ROC curve and AUC based on LOOCV.
As a result, new prediction method increase an AUC of 0.037 and 0.0438, respectively, demonstrating that predictive accuracy has been improved by the operation of introducing new disease similarity and lncRNA functional similarity calculated from LNCSIM.

