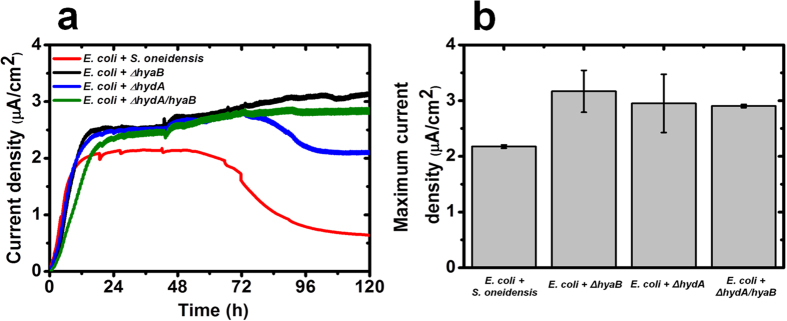
Figure 2. Electrical output of MFCs inoculated with co-cultures of E. coli, S. oneidensis and mutant hydrogenases microbial strains.

(a) Current density generated as a function of time. (b) Maximum current density (average ± standard deviation). Data represent the average of triplicates.
