Abstract
To understand factors contributing to the neonatal mortality rate (NMR), we studied trends in the NMR during 2000 to 2009 with respect to demographic factors and health care resources. Birth- and death-linked mortality data for 14,168 neonatal deaths that occurred between 2000 and 2009 were obtained from the Texas Department of Health and Human Services. Demographic factors and health care resource data were analyzed using analysis of variance, chi-square tests, and linear regression analysis. The average NMR increased from 3.37 in 2000 to 3.77 in 2009. The NMR in blacks ranged from 6.57 to 8.97 during the study period. Among the babies who died, the mean birthweight decreased from 1505 to 1275 g (P < 0.001) and the mean gestational age decreased from 28.4 to 27.8 weeks (P < 0.001). Cesarean section deliveries increased from 32.7% to 44.9% (P < 0.001). The percentage of mothers receiving prenatal care increased from 81.4% to 86.6% (P < 0.001). Mothers with a college education increased from 8.8% to 20.5% (P < 0.001). The median household income increased from $41,047 to $49,189 (P < 0.001). The number of neonatal intensive care unit beds increased from 33.4 to 56 per 10,000 births, and the number of neonatologists increased from 0.27 to 0.40 per 10,000 women of 15 to 44 years of age. In conclusion, the NMR didn't improve despite improvements in demographic factors and health care resources. Racial disparities persist, with a high NMR in the black population. We speculate a possible genetic predisposition related to ethnicity, and a potentially higher rate of extreme prematurity might have contributed to a high NMR in the study population.
The neonatal mortality rate (NMR) and the infant mortality rate are often used to indicate the effectiveness of maternal and child health care services (1, 2). In the United States, neonatal mortality has decreased steadily during the previous three decades. However, in the last 10 years, the decrease has been marginal. The US NMR was 4.19 in 2009 (3). Texas is the second-largest state in population, and in 2009, it ranked 18th regarding NMR in the USA (3). Because it is a large state with diverse sociodemographic factors and has a high NMR, Texas is an important context in which to study the effectiveness of maternal and child health care services. This study examined trends in the NMR and their relation to underlying variables such as maternal sociodemographic factors and available health care resources in the state of Texas from 2000 to 2009.
METHODS
In this study, we used publicly available information obtained from the Texas Department of Health and Human Services (TDHHS). The study received approval from the institutional review board of Baylor Scott and White Healthcare.
Data for neonates who died under the age of 28 days were collected from TDHHS for the period of 2000 to 2009. Birth and death certificate data were linked by TDHHS during the study period. The number of obstetrics and gynecology providers and neonatologists, along with the number of beds available in neonatal intensive care units (NICU), was also obtained from TDHHS.
Important outcome variables studied included NMR, ethnicity (white, black, Hispanic, and other), and key demographic determinants of NMR including maternal age, birthweight, educational level, socioeconomic status, gestational age, prenatal care, cause of death, method of delivery, and maternal smoking. Variables regarding health care included number of available beds in the NICU and number of obstetrics providers and neonatologists. The NMR is the number of neonatal deaths during a year, divided by the number of live births during the same year, expressed per 1000 live births.
Characteristics were summarized according to ethnicity and year by descriptive statistics: mean (± standard deviation) for continuous variables and frequency (percent) for categorical variables. Multivariable Poisson regression analysis and multivariable negative binomial regression analysis were utilized to investigate the significance of ethnicity, median income, and year on NMR. Proportion comparisons were assessed utilizing chi-square test. Linear regression analysis or the Cochran-Armitage trend test was used for trend analysis. A P value of < 0.05 indicates statistical significance. SAS 9.2 (SAS Institute Inc, Cary, NC) was used for data analysis.
RESULTS
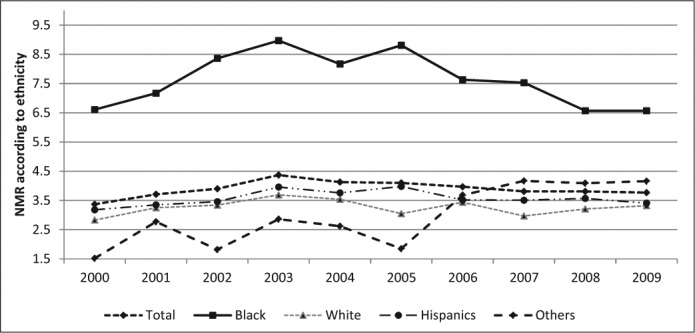
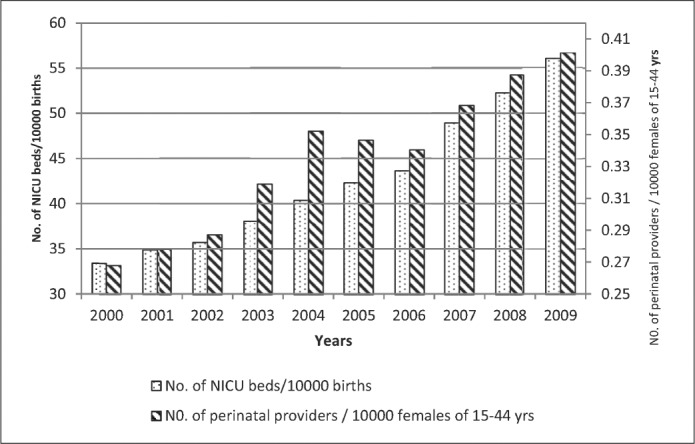
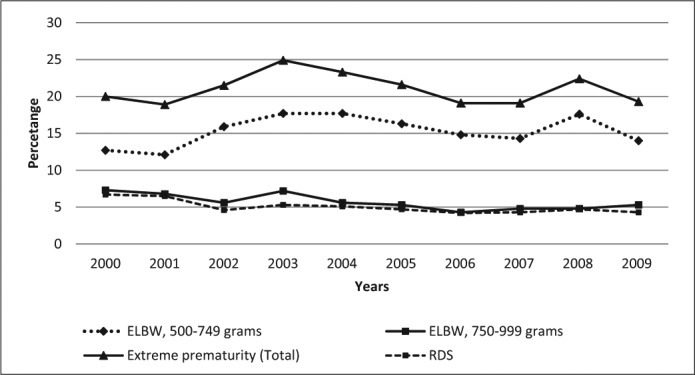
Between 2000 and 2009, a total of 14,168 death records of neonates younger than 28 days old and associated birth records were obtained and the characteristics of neonatal death were assessed. The NMR according to ethnicity, mean birthweight, mean gestational age, mode of delivery, prenatal care, maternal age, maternal education, incidence of smoking, median household income, number of NICU beds per 10,000 births, and number of neonatal providers and obstetricians per 10,000 females of 15 to 44 years are shown in Table 1. Figures 1 to 3 highlight the NMR by ethnicity and by cause and the growing number of resources over the time period.
Table 1.
The neonatal mortality rate in Texas and accompanying socioeconomic factors from 2000 to 2009 using information collected from records of 14,168 neonatal deaths
| Variables | 2000 | 2001 | 2002 | 2003 | 2004 | 2005 | 2006 | 2007 | 2008 | 2009 |
|---|---|---|---|---|---|---|---|---|---|---|
| NMR (all) | 3.37 | 3.71 | 3.90 | 4.37 | 4.13 | 4.10 | 3.97 | 3.81 | 3.81 | 3.77 |
| NMR (blacks) | 6.61 | 7.17 | 8.36 | 8.97 | 8.17 | 8.81 | 7.63 | 7.53 | 6.57 | 6.57 |
| NMR (whites) | 2.83 | 3.25 | 3.34 | 3.69 | 3.54 | 3.05 | 3.44 | 2.97 | 3.21 | 3.32 |
| Mean birthweight (g)* | 1505 | 1436 | 1358 | 1310 | 1333 | 1217 | 1270 | 1295 | 1268 | 1275 |
| Mean GA (weeks)* | 28.4 | 28.4 | 27.8 | 27.4 | 27.5 | 27.4 | 27.7 | 27.7 | 27.5 | 27.8 |
| Mode of delivery (cesarian section)* | 32.7% | 30.2% | 28.9% | 27.5% | 29.0% | 41.9% | 42.6% | 44.1% | 41.9% | 44.9% |
| Prenatal care | 81.4% | 80.0% | 80.1% | 80.9% | 82.2% | 85.1% | 87.1% | 85.0% | 84.5% | 86.6% |
| Maternal age (years) | 26.4 | 26.7 | 26.5 | 26.8 | 27.0 | 27.2 | 26.9 | 27.1 | 27.2 | 27.7 |
| Maternal education (college)* | 8.8% | 7.5% | 7.6% | 7.9% | 8.9% | 17.8% | 17.7% | 18.6% | 17.6% | 20.5% |
| Smokers | 8.4% | 8.2% | 7.0% | 8.0% | 6.7% | 8.9% | 8.6% | 9.6% | 7.0% | 7.6% |
| Median household income* (thousands/year) | 41.0 | 41.0 | 40.9 | 41.4 | 42.0 | 43.2 | 45.8 | 48.8 | 50.7 | 49.2 |
| NICU beds/10,000 births | 33.4 | 34.9 | 35.7 | 38.1 | 40.4 | 42.3 | 43.6 | 48.9 | 52.2 | 56.0 |
| Neonatologists/10,000 females of 15–44 yr | 0.27 | 0.28 | 0.29 | 0.32 | 0.35 | 0.35 | 0.34 | 0.37 | 0.39 | 0.40 |
| Obstetricians/10,000 females of 15–44 yr | 0.05 | 0.04 | 0.04 | 0.04 | 0.06 | 0.06 | 0.06 | 0.06 | 0.05 | 0.04 |
NMR indicates neonatal mortality rate; GA, gestational age; NICU, neonatal intensive care unit.
P < 0.001.
Figure 1.

Neonatal mortality rate among various ethnicities from 2000 to 2009 in Texas.
Figure 3.

Number of neonatal intensive care unit beds per 10,000 births and number of perinatal providers in Texas per 10,000 females 15 to 44 years of age from 2000 to 2009.
Figure 2.

Leading causes of neonatal deaths from 2000 to 2009 in Texas. ELBW indicates extremely low birthweight; RDS, respiratory distress syndrome.
DISCUSSION
The NMR declined from 15.1 in the 1970s to about 6.1 in the 1990s due to advances in neonatal critical care; however, the NMR has remained relatively unchanged in recent years (4). Advances in the care of sick neonates did not impact the NMR, unlike the previous few decades (4). In our study, we found similar results, suggesting the NMR did not change significantly from 2000 to 2009.
In 2009, the NMR was 3.78 in Texas, compared with 2.69 in Minnesota (3). Texas ranked 18th in the USA in NMR (3). In the black population in Texas, the NMR remained relatively unchanged and high (6.61 in 2000 and 6.57 in 2009). These findings are consistent with current neonatal outcomes in the USA (5).
The percentage of women receiving prenatal care and average maternal age remained the same over the period of the study. We noticed an increasing trend of mothers with a college education. This trend is similar to the trend found in the country as a whole by Hamilton et al (6). There is also an increasing trend for cesarean deliveries. Multiple studies have shown a negative relation between cesarean section rates and neonatal outcomes (7). The cesarean section rate increase can be correlated with decreased gestational age and birthweight, as more premature and sicker babies tend to be born via cesarean section. In our study, cesarean section rates increased from 32.7% to 44.9%. Our study did not show a similar correlation.
In our study, the median household income increased from $41,000 to $49,200 from 2000 to 2009. In spite of increasing median household income, the NMR remained relatively unchanged. Olson et al documented a negative association between median family income and all birth outcomes (8). Subramanian et al (9) and Shmueli (10) have shown an inverse association between median income and health disparities. We were unable to show a similar trend in our study.
Advances in neonatal critical care medicine, and better resource availability as evidenced by higher numbers of neonatologists, obstetricians, and available NICU beds, did not have an effect on the NMR. These findings correlate with the findings of Thompson et al (11), who found that in spite of having greater resources regarding neonatal care per capita compared with Canada, the United Kingdom, and Australia, neonatal outcomes in the US are lagging. This may suggest that neonatal care providers, NICU beds, and hospitals are one part of the health care delivery system, and it may suggest a need to focus on sociodemographic factors.
The mean birthweight and gestational age showed decreasing trends in our analysis. Extremely low birthweight infants with a birthweight of 500 to 999 g and respiratory distress syndrome or respiratory failure were leading causes of mortality in the study group. This finding suggests that extreme prematurity and its complications are still leading contributors to the NMR. Efforts targeted against extreme prematurity may help to decrease the NMR.
We obtained our data set from TDHHS and thus were dependent on the accuracy of data reporting. The data set could have been limited by poor reporting and the misclassification of births as stillbirths.
In conclusion, in our study, NMR did not change significantly from 2000 to 2009 despite improvements in maternal age, decreased smoking, improved education, higher median household income, and an increased number of NICU beds and perinatal providers. Racial disparities persist, with a high NMR in the black population. We speculate that a possible genetic predisposition related to ethnicity and a potentially higher rate of extreme prematurity might have contributed to a high NMR in the study population. However, additional studies are needed to explore these factors.
References
- 1.Heisler EJ. The U.S. Infant Mortality Rate: International Comparisons, Underlying Factors, and Federal Programs [CRS Report for Congress] Washington, DC: Congressional Research Service; April 4, 2012. Available at https://www.fas.org/sgp/crs/misc/R41378.pdf; accessed March 30, 2015. [Google Scholar]
- 2.MacDorman MF, Mathews TJ. Behind International Rankings of Infant Mortality: How the United States Compares with Europe [NCHS Data Brief No. 23] Hyattsville, MD: National Center for Health Statistics; 2009. Available at http://www.cdc.gov/nchs/data/databriefs/db23.htm; accessed March 30, 2015. [PubMed] [Google Scholar]
- 3.Kochanek KD, Kirmeyer SE, Martin JA, Strobino DM, Guyer B. Annual summary of vital statistics: 2009. Pediatrics. 2012;129(2):338–348. doi: 10.1542/peds.2011-3435. [DOI] [PMC free article] [PubMed] [Google Scholar]
- 4.MacDorman MF, Mathews TJ. Recent Trends in Infant Mortality in the United States [NCHS Data Brief No. 9] Hyattsville, MD: National Center for Health Statistics; 2008. Available at http://www.cdc.gov/nchs/data/databriefs/db09.htm; accessed March 30, 2015. [PubMed] [Google Scholar]
- 5.Collins JW, Jr, David RJ. Racial disparity in low birth weight and infant mortality. Clin Perinatol. 2009;36(1):63–73. doi: 10.1016/j.clp.2008.09.004. [DOI] [PubMed] [Google Scholar]
- 6.Hamilton BE, Hoyert DL, Martin JA, Strobino DM, Guyer B. Annual summary of vital statistics: 2010–2011. Pediatrics. 2013;131(3):548–558. doi: 10.1542/peds.2012-3769. [DOI] [PMC free article] [PubMed] [Google Scholar]
- 7.MacDorman MF, Declercq E, Menacker F, Malloy MH. Neonatal mortality for primary cesarean and vaginal births to low-risk women: application of an “intention-to-treat” model. Birth. 2008;35(1):3–8. doi: 10.1111/j.1523-536X.2007.00205.x. [DOI] [PubMed] [Google Scholar]
- 8.Olson ME, Diekema D, Elliott BA, Renier CM. Impact of income and income inequality on infant health outcomes in the United States. Pediatrics. 2010;126(6):1165–1173. doi: 10.1542/peds.2009-3378. [DOI] [PubMed] [Google Scholar]
- 9.Subramanian SV, Kawachi I. Income inequality and health: what have we learned so far? Epidemiol Rev. 2004;26(1):78–91. doi: 10.1093/epirev/mxh003. [DOI] [PubMed] [Google Scholar]
- 10.Shmueli A. Cost-effective outlays for better health outcomes. World Health Forum. 1995;16(3):287–292. [PubMed] [Google Scholar]
- 11.Thompson LA, Goodman DC, Little GA. Is more neonatal intensive care always better? Insights from a cross-national comparison of reproductive care. Pediatrics. 2002;109(6):1036–1043. doi: 10.1542/peds.109.6.1036. [DOI] [PubMed] [Google Scholar]


