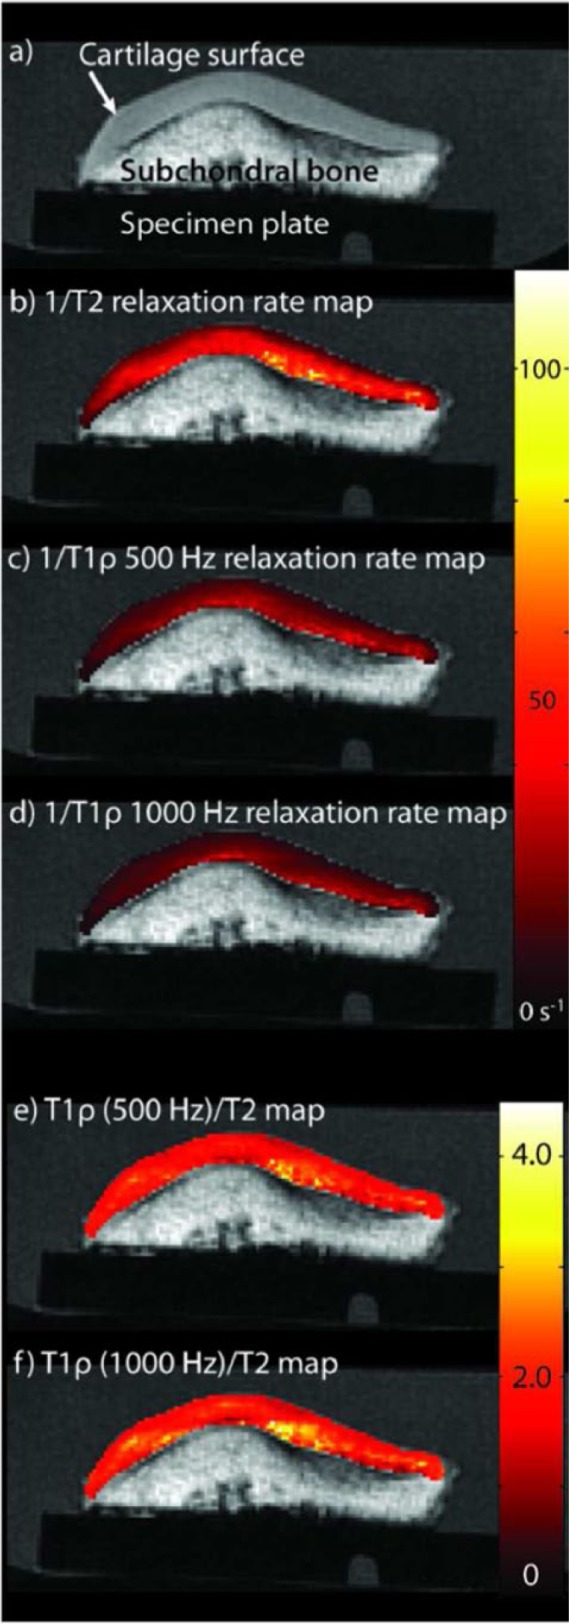
Figure 4.

An axial spoiled gradient echo (SPGR) image from one patella specimen is shown (A); the main magnetic field, B0, is perpendicular to the image plane. Representative 1/T2 (B) and 1/T1ρ relaxation time maps for 500 Hz (C), and 1000 Hz (D) are shown. Representative T1ρ/T2 maps are shown for T1ρ 500 Hz (E) and T1ρ 1000 Hz (F).
