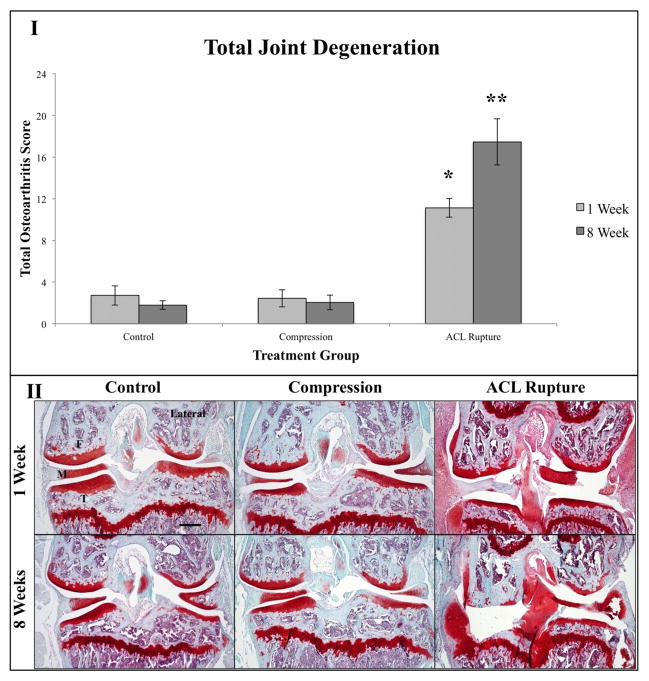
Figure 2.
Results from histology with Safranin-O/Fast Green staining. I) Graph comparing total degenerative scores for control, 240-cycle compression, and ACL rupture knees. “*” denotes that after one week the ACL ruptured joints were statistically significantly higher in their total degeneration score than the control and 240-cycle impaction group (p=0.003 and p<0.001, respectively). “**” denotes that after eight weeks the ACL ruptured joints were statistically significantly higher in their total degeneration score than the control and 240-cycle impaction group (p=0.004 and p=0.003, respectively). II) Representative pictures of knees at all three conditions at one and eight weeks. Lateral side is marked as reference. Femur (F), meniscus (M), and tibia (T) are labeled. All micrographs were taken at 5x magnification. Scale Bar=300 μm.

