
Figure 4.
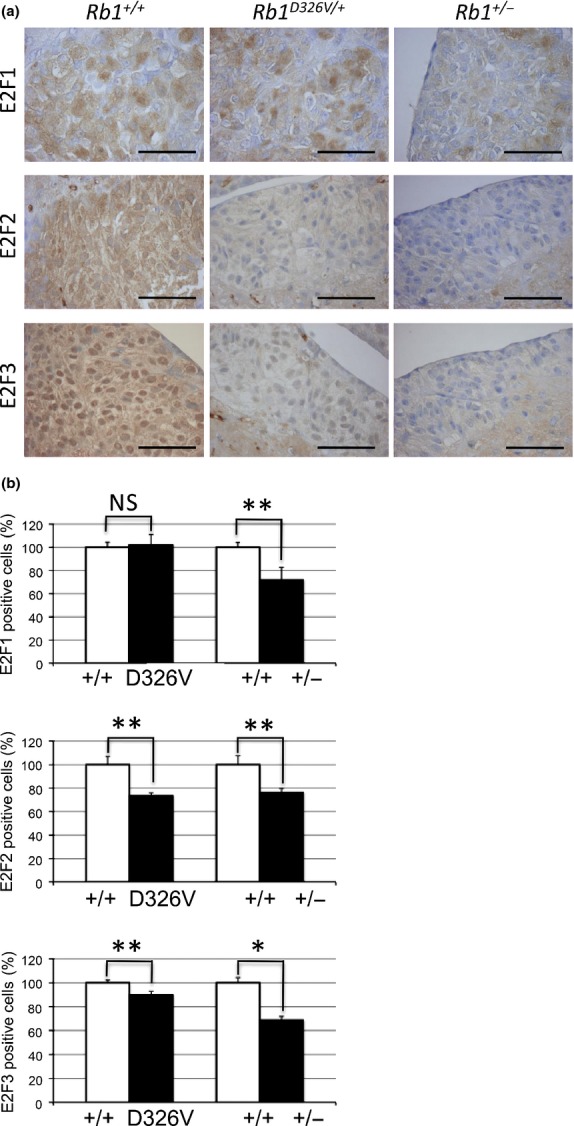
Immunohistochemical analysis of E2F in normal intermediate lobe of the pituitary (ILP) cells. (a) Normal ILP tissues from retinoblastoma gene (Rb1)+/+ (left column), Rb1D326V/+ (middle column) or Rb1+/− (right column) mice were incubated with anti-E2F1 (upper row), anti-E2F2 (middle row) or anti-E2F3 (lower row) antibody. Bar, 50 μm. (b) The positive-cell ratio was analyzed in the ILP specimens treated with anti-E2F1 (upper panel), anti-E2F2 (middle panel) or anti-E2F3 (lower panel) antibody. The positive-cell ratios were calculated as described in Figure3(b). Statistical analysis: unpaired two-tailed Student's t-test. NS, not significant. *P < 0.05. **P < 0.01. Error bar, SD. n = 3 per genotype.