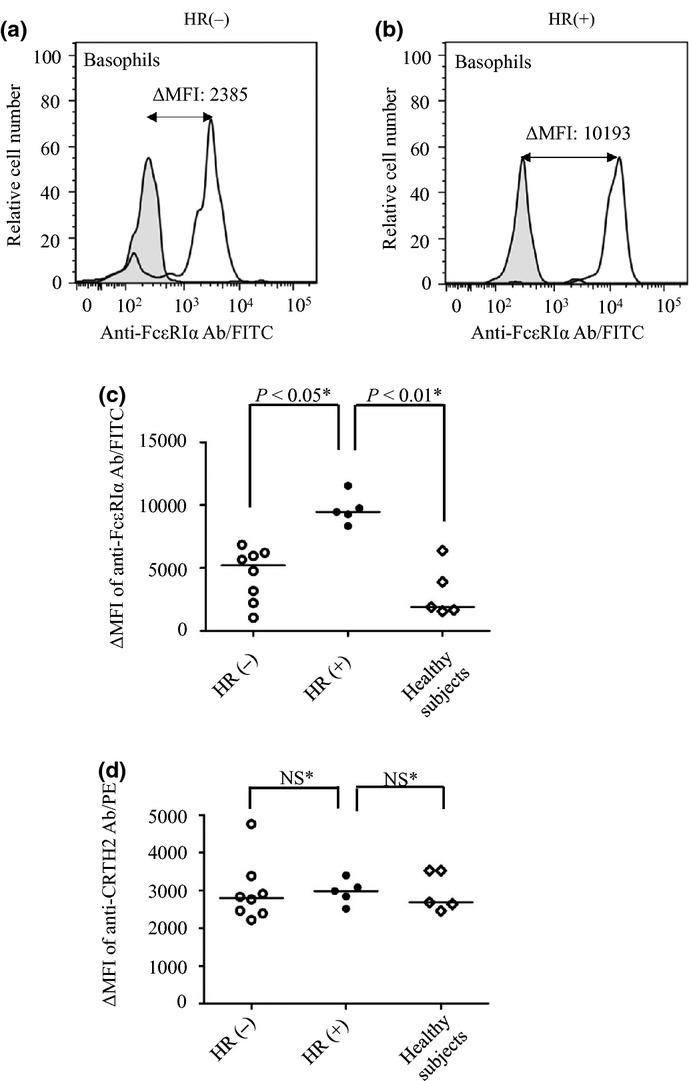
Fig 4.

Expression levels of FcεRI on basophils in hypersensitivity reaction (HR)(+) and HR(−) patients. Flow cytometric analysis of FcεRI on basophils was performed by incubation of whole blood sample from study subjects with FITC-conjugated anti-human FcεRI α chain antibody. Histograms from a typical HR(−) (a) and HR(+) patient (b) are shown (unshaded histograms). An isotype control antibody was also used as a negative control (shaded histograms). ΔMFI is calculated as the difference in mean fluorescence intensity (MFI) between the FITC-labeled anti-human FcεRIα chain antibody and its isotype control. (c) The ΔMFI is compared between HR(+) (n = 5) and HR(−) (n = 8) patients, as well as healthy subjects (n = 5). (d) The ΔMFI of PE-conjugated anti-CRTH2 (prostaglandin D2 receptor) antibody used as a reference protein is compared between the three groups. The horizontal line inside the graph represents the median value within each group. The expressions of FcεRI and CRTH was analyzed using two or three different samples from each patient. Differences between the three groups were analyzed using Dunnett's multiple comparison tests.
