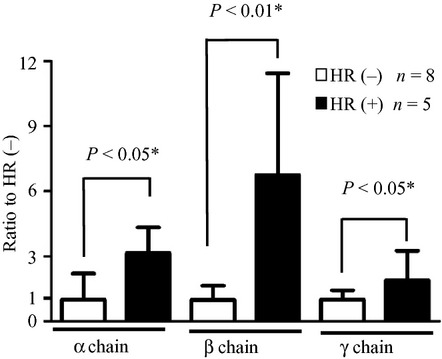
Fig 5.

Expression levels of α, β, and γ chains of FcεRI mRNA in the peripheral blood of hypersensitivity reaction (HR)(−) and HR(+) patients. Total RNA was isolated from blood samples, and analyzed by real-time RT-PCR. Relative mRNA levels of FcεRIα, β, and γ chains were quantified relative to the expression levels of GAPDH. Data are presented as the mean ± SD. Statistical analyses between the two groups were carried out using the Mann–Whitney U-test.
