
Fig 2.
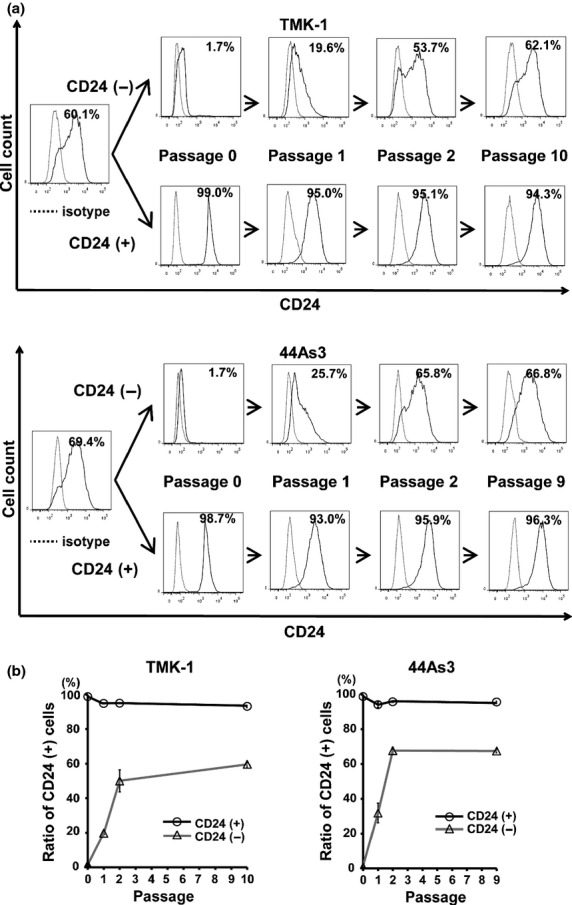
Single directional convergence into the CD24-positive from CD24-negative GCa cells under normoxia. (a) Representative histograms of chronological changes in sorted CD24-positive cells versus CD24-negative cells. Upper panels, TMK-1; lower panels, 44As3. Percentages shown in figures are the positive rate of CD24. (b) Quantitative FACS analyses of CD24-positive populations in GCa cells by the prolonged culture in normoxia.