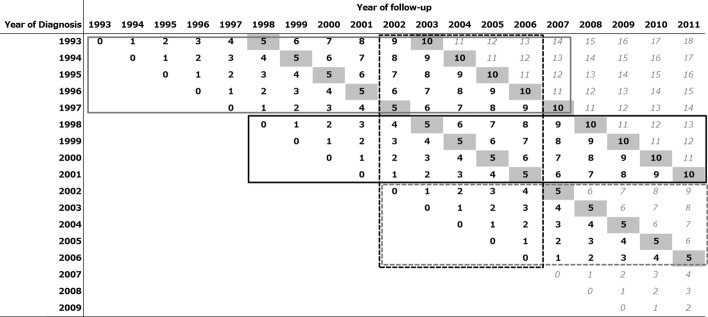
Fig 1.

Diagnosed and followed-up years of submitted patient data from six Japanese prefectural cancer registries. Bold black figures indicate data from all six prefectures; gray figures mean a limited number of registries have provided data. The solid gray line box shows the data used to calculate 10-year survival for patients diagnosed between 1993 and 1997 using conventional methods (cohort approach). The solid black line box shows the data used to calculate 10-year survival for patients diagnosed between 1998 and 2001 using the cohort approach. The dashed gray line box shows the data to calculate 5-year survival for patients diagnosed between 2002 and 2006 using the cohort approach. The dashed black line box shows the data for period approach we applied in this study.
