
Fig 3.
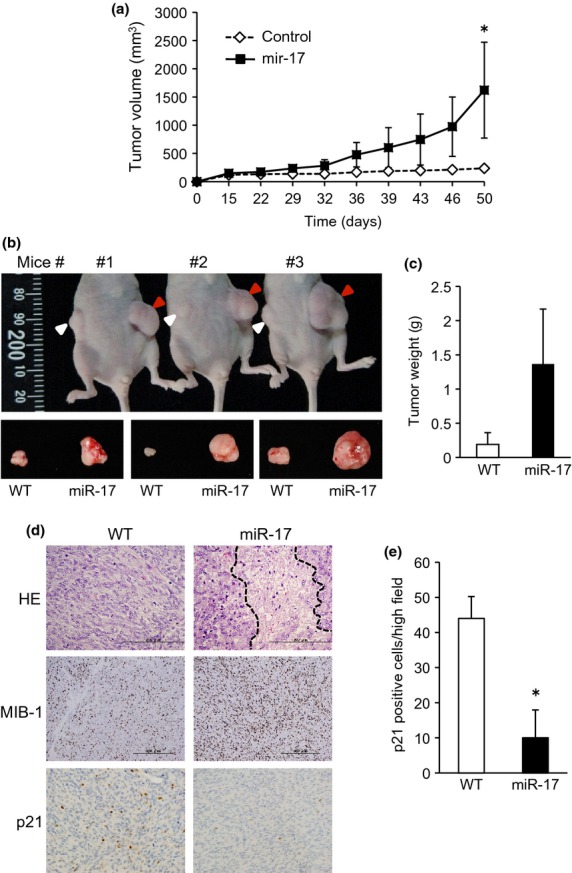
MiR-17 promoted tumor formation of synovial sarcoma in in vivo mice. (a) MiR-17-overexpressing Fuji and its control cells were injected s.c. into nude mice. The tumor volume was measured twice a week, and plotted in the graph. *P < 0.05 versus control tumor. (b, c) 50 days post-implantation, mice were killed and resected tumor weights were measured and graphed (c). Red and white arrowheads indicate miR-17-overexpressing tumors and control, respectively. (d) Tumor tissues were subjected to H&E staining and immunostaining for Ki-67 and p21. Region surrounded by dashed lines shows necrosis in the center of the tumor. (e) p21 positive cells were counted in randomly selected three regions and graphed.