Fig 2.

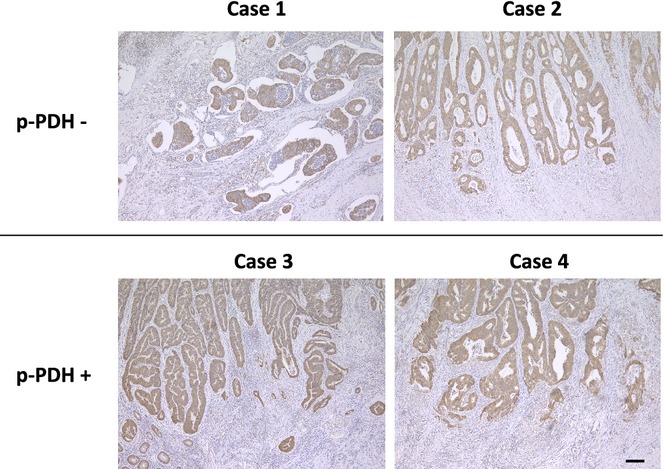
Immunohistochemical analysis of PDH-E1α. Representative images of PDH-E1α staining in p-PDH negative cases (case 1 and 2) and p-PDH positive cases (cases 3 and 4). Scale bar, 100 μm.

Immunohistochemical analysis of PDH-E1α. Representative images of PDH-E1α staining in p-PDH negative cases (case 1 and 2) and p-PDH positive cases (cases 3 and 4). Scale bar, 100 μm.