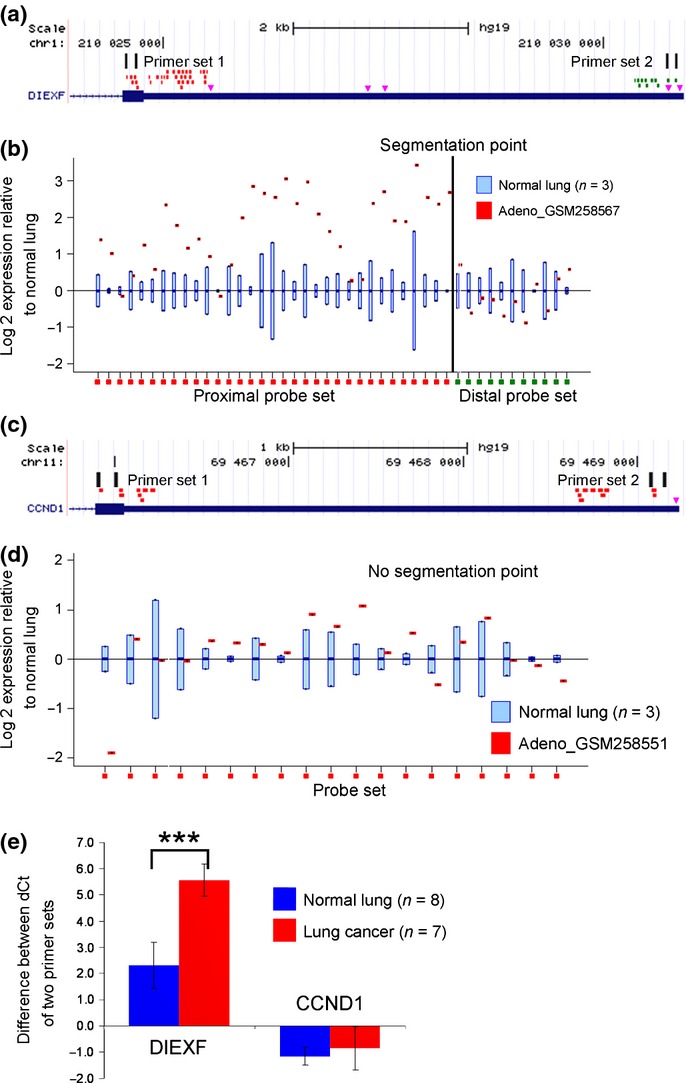
Fig 2.

Selection of the alternative polyadenylation (APA)-indicator genes using the Rmodel. (a) The Affymetrix probes were divided into two groups by the rmodel; the proximal probe set is shown in red and the distal probe set is shown in green. The pink triangles indicate the major poly(A) signals AAUAAA and AUUAAA. Two primer sets were designed to evaluate the ratio of the transcripts with full-length 3′UTR to the total transcripts. (b) A positive example. DIEXF showed loss of signal in the 3′-terminal portion of the transcript in lung adenocarcinoma GSM258567, relative to that in the normal lung. (c and d) A negative example. CCND1 showed uniform signals along the 3′UTR. (e) Quantitative RT-PCR revealed that CCND1 was not affected by APA in the clinical samples, indicating that the observed 3′UTR shortening of other transcripts was not a result of random degradation of the transcripts in the tumor samples. ***P < 0.001.
