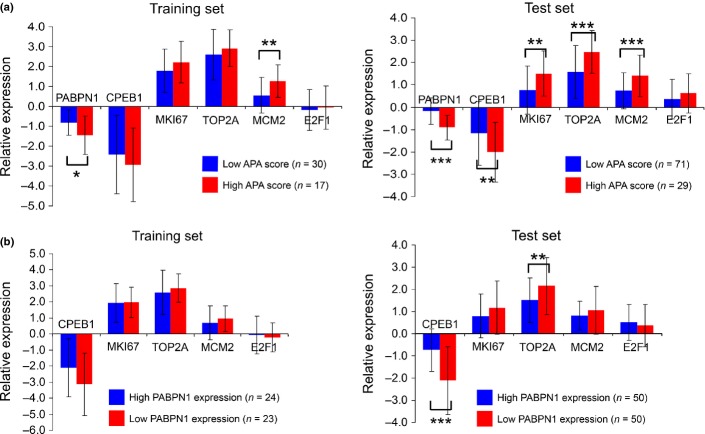
Fig 5.
The expression levels of the alternative polyadenylation (APA)-related genes is shown for the APA score (a) and for PABPN1 expression (b). Results are normalized to the normal lung tissues and shown as the average ± SD. Suppression of PABPN1 was independent of the upregulation of proliferation markers. *P < 0.05; **P < 0.01; ***P < 0.001.

