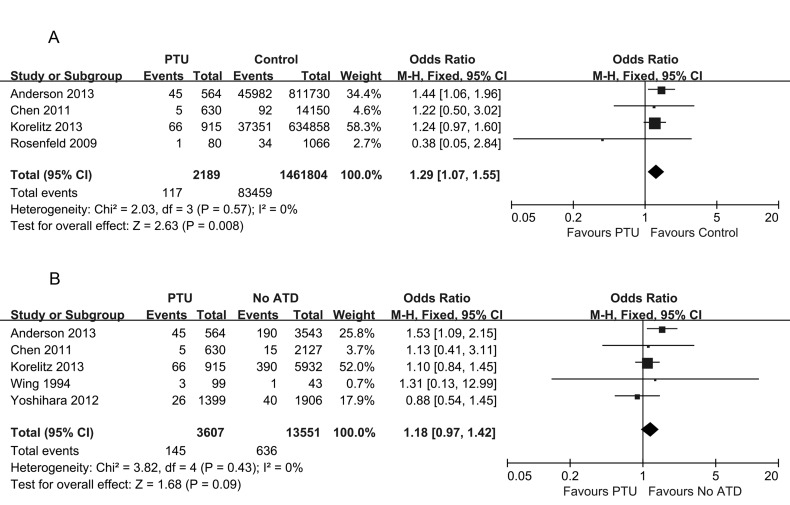
Figure 2.
Forest plot of the odds ratios and 95% confidence intervals of the pooled studies. (A) PTU-treated pregnant hyperthyroid women compared with healthy pregnant women according to the risk of congenital anomalies. (B) PTU-treated pregnant hyperthyroid women compared with pregnant hyperthyroid women not receiving any ATD treatment according to the risk of congenital anomalies.

