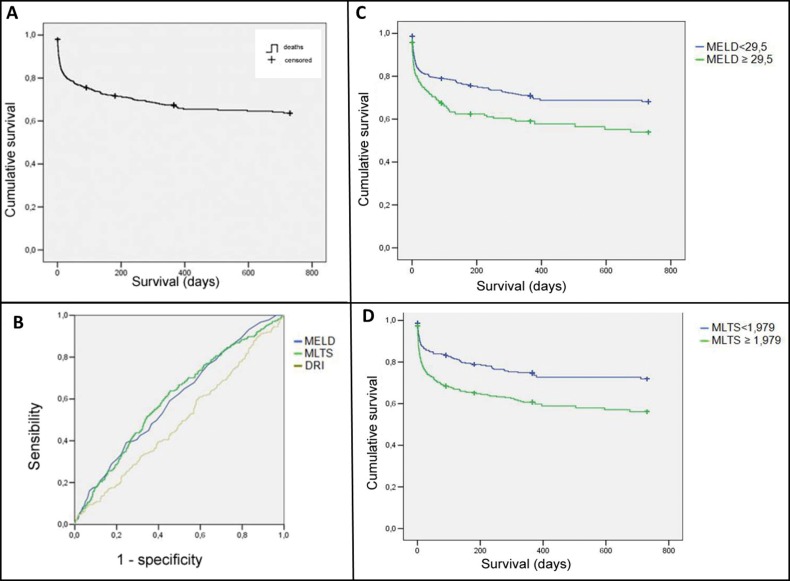
Figure 1.
A) The Kaplan-Meier curve for the survival of 1,006 patients who received a liver transplant in the state of São Paulo between 2006 and 2009. B) The ROC curves of the MELD, MLTS, and DRI scores for 2-year mortality for 1,006 liver transplants performed in the state of São Paulo between 2006 and 2009. C) The Kaplan-Meier curves for mortality according to the MELD scores for 1,006 liver transplants performed in the state of São Paulo between 2006 and 2009. D) The Kaplan-Meier curves for mortality according to the MLTS scores for 1,006 liver transplants performed in the state of São Paulo between 2006 and 2009.

