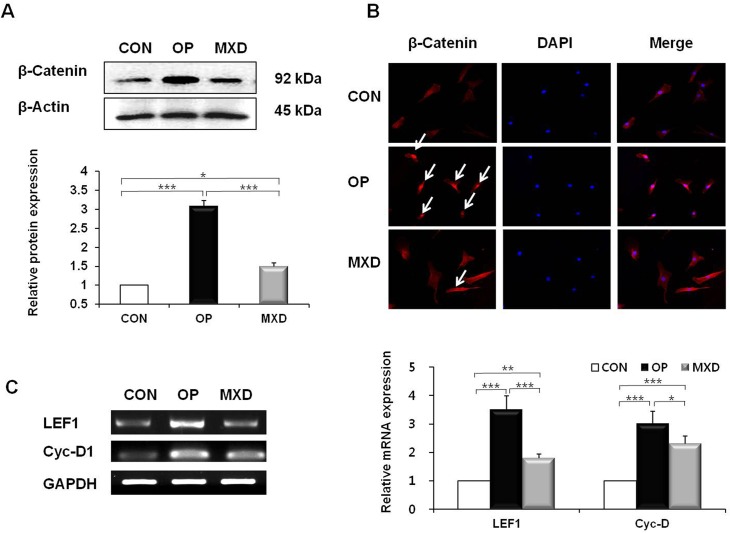
Fig 2. Effect of oleuropein on the activation status of the Wnt/β-catenin pathway in DPCs.
DPCs were treated with 20 μM OP or 100 μM MXD for 24 h. (A) The protein level of β-catenin in the DPCs was determined by western blotting. A representative image of triplicate experiments is shown in the upper panel. The lower panel shows the intensity of the bands that were densitometrically measured and normalized against the protein level of β-actin. (B) DPCs were immunocytochemically stained with β-catenin antibody (left column panel), and the corresponding DAPI nuclear staining is also shown (middle column panel); merged images are shown in the right column panel. Original magnification: 20×. (C) LEF1 and Cyc-D1 mRNA levels were measured by RT-PCR. A representative image of triplicate experiments is shown in the left panel. The right panel shows the intensity of the bands that were densitometrically measured and normalized against the mRNA expression level of GAPDH. The western blotting and RT-PCR results are the mean ± SD from duplicates of three independent experiments. * = p < 0.05, ** = p < 0.01, *** = p < 0.001 (one-way ANOVA, Tukey's test).

