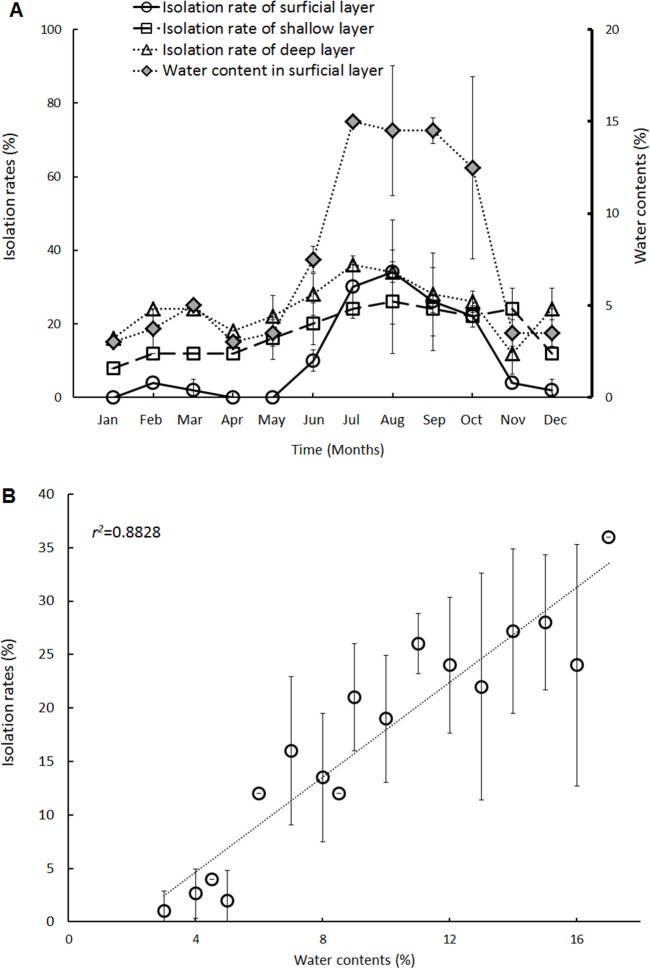
Fig 2. The isolation rate distribution and correlations between the isolation rate and moisture content.
The soil (<10 cm, superficial layers, circle; 30 cm, shallow layer, square; 60 cm, deep layer, hollow triangle) was sampled in a vertical distribution. The average monthly isolation rates of B. pseudomallei from each layer are shown. The moisture (water) contents in the superficial layer are labeled with grey diamonds (A), and the isolation rates are shown for the indicated moisture contents (B).

