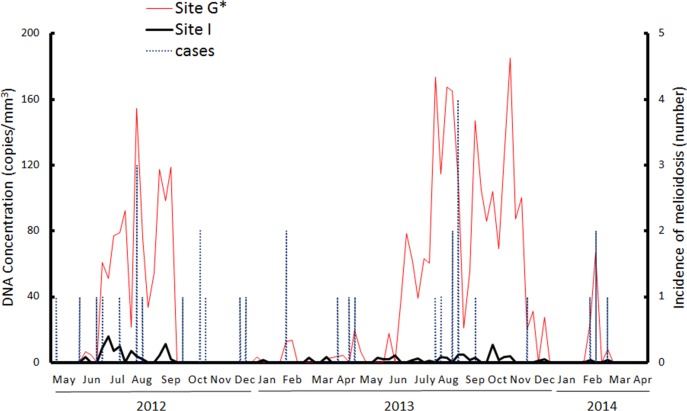
Fig 4. B. pseudomallei-specific DNA concentration and melioidosis cases.
From May 2012 to April 2014, the B. pseudomallei-specific DNA concentration was measured from the total air particles collected from Sites G (red line) and I (black line) (location see Fig 1). The melioidosis cases (blue dotted line) are shown. The symbol (*) indicates the correlation between contaminated aerosols and the melioidosis incidence.

