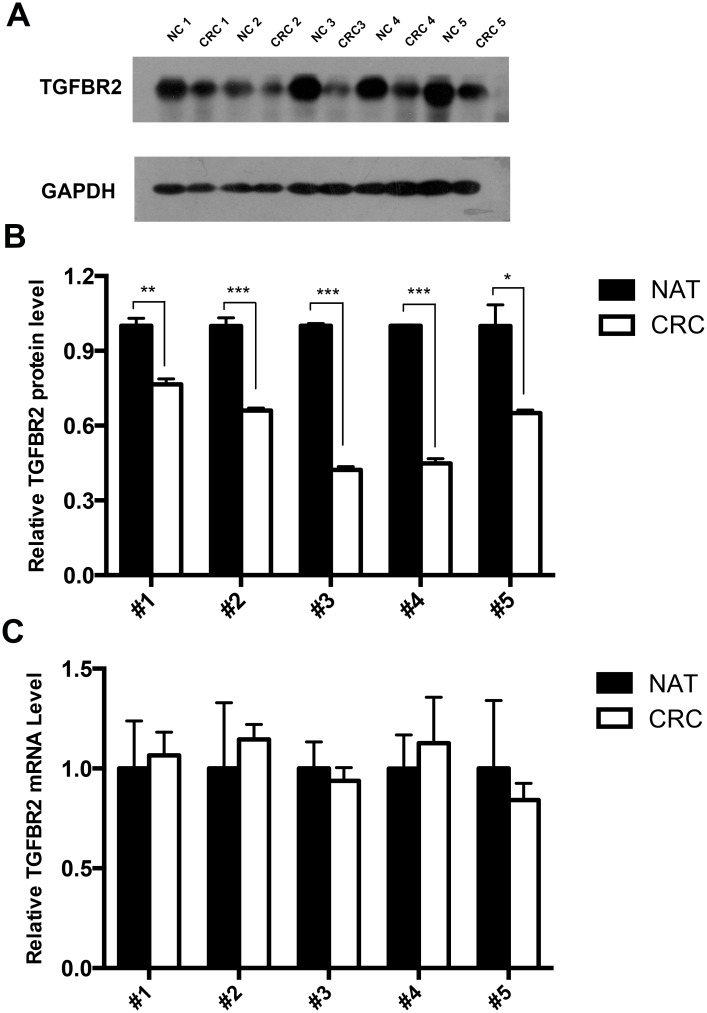
Fig 1. Upregulation of the TGFBR2 protein, but not mRNA, in CRC tissues.
(A and B) Western blot analysis of the TGFBR2 protein levels in five paired CRC and normal adjacent tissue (NAT) samples. A: representative image; B: quantitative analysis. (C) Quantitative RT-PCR analysis of the TGFBR2 mRNA levels in five paired CRC and NAT tissue samples. * P < 0.05; ** P < 0.01; *** P < 0.001.

