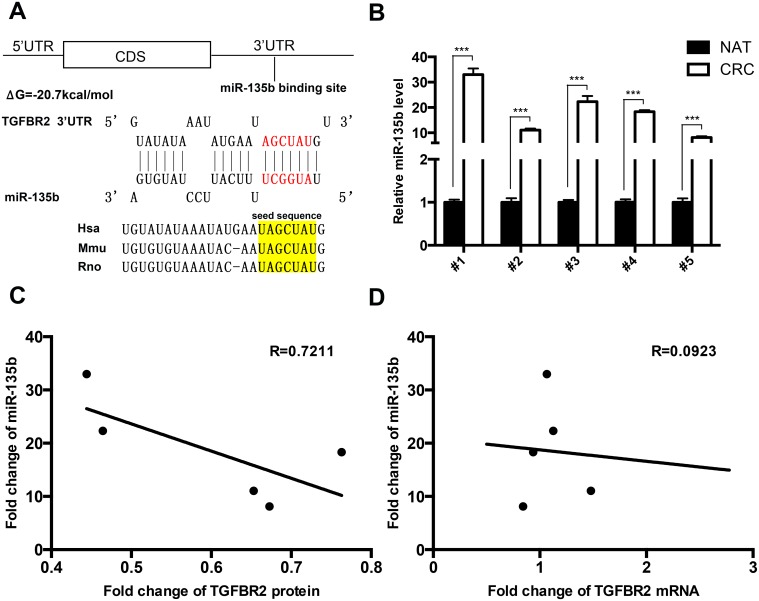
Fig 2. Identificatopn of an inverse correlation between the miR-135b levels and the TGFBR2 protein levels in CRC tissues.
(A) Schematic of the hypothetical duplexes formed by the interaction between the binding sites in the TGFBR2 3’-UTR (top) and miR-135b (bottom). The predicted free energy value of this interaction is indicated. The seed recognition sites are denoted, and all nucleotides in these regions are highly conserved across several species, including human, mouse and rat. (B) Quantitative RT-PCR analysis of the miR-135b levels in five paired CRC and NAT tissue samples. (C) Pearson’s correlation scatter plot of the fold change of miR-135b and TGFBR2 protein in human CRC tissues. (D) Pearson’s correlation scatter plot of the fold change of miR-135b and TGFBR2 mRNA in human CRC tissues. * P < 0.05; ** P < 0.01; *** P < 0.001.

