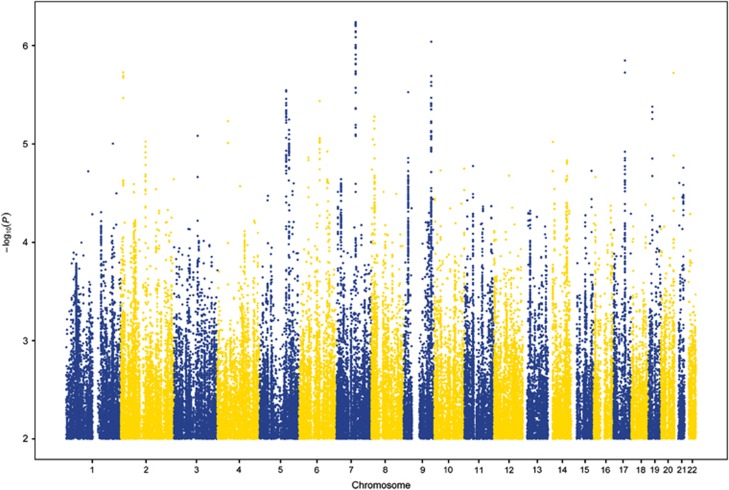
Figure 1.
Association results from the genome-wide association study of adult antisocial behavior. On the x axis are single-nucleotide polymorphism (SNP) positions for chromosomes 1–22. On the y axis are negative logarithms (base 10) of the P-values for each SNP, whereby higher values indicate smaller P-values.

