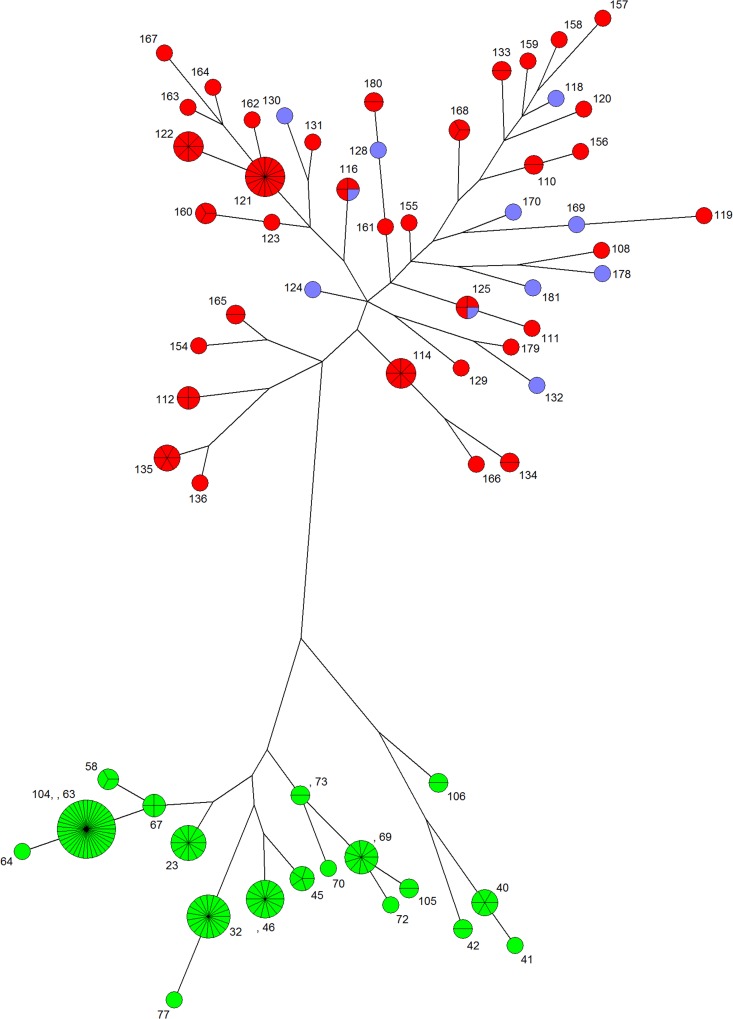
FIG 2 .
Maximum-parsimony trees for isolates of serotypes A and D. Maximum-parsimony trees were constructed with concatenate sequences of the 7 MLST loci for the 97 serotype D isolates and the 121 serotype A isolates. Green nodes, serotype A MATα; red nodes, serotype D MATα; blue nodes, serotype D MATa. The denomination of the sequence type (ST) is indicated for each node. The size of the nodes increased with the number of isolates sharing similar sequences. The size of the lines between nodes increased with the number of differing nucleotides. Logarithmic scaling for branches was used.

